Temporal Metrics, the Four-Number Triage, and Capacity Planning on PostgreSQL
On this page
- Two families of metrics
- The four-number triage for "Temporal is slow"
- Why this order
- The four numbers as PromQL
- When schedule-to-start is high: my workers or the server?
- Inside the server: five checks, in order
- 1. A rate limiter said no: service_errors_resource_exhausted by cause
- 2. Waiting for the shard's IO slot: semaphore_latency
- 3. The database: persistence_latency by operation
- 4. One hot workflow: lock_latency
- 5. GC thrash: cache_usage, memory_heap, CPU
- The traps that make metrics lie
- Delta vs cumulative
- The queue that had "0 pollers"
- More server-side traps
- What to watch, and the thresholds
- Capacity: the smallest ceiling wins
- The unit of capacity: writes per workflow
- The ladder of ceilings
- Never plan for 100 %
- Worked example: our real numbers
- Prove it with a step-ramp benchmark
- Build staging to match production
- Choose the workload and ramp it
- Record per step
- Find the knee
- Deriving the numbers from the benchmark
- History hosts
- shardIOConcurrency: raise until persistence p99 bends
- Partitions per hot task queue
- Connections: the budget that ties it together
- Is it Temporal or PostgreSQL?
- The capacity chain, and why more servers can mean less throughput
- What I'd tell myself before go-live
TL;DR: Temporal exposes hundreds of metrics, and most of them don't matter at 3 a.m. For "Temporal is slow" I ask four numbers in a fixed order: schedule-to-start (is the task waiting?), worker slots available (are the workers full?), activity execution latency (is it my code?), and server
service_latency(is it really Temporal?). Only the last one opens the server, and there I check five things in order:RESOURCE_EXHAUSTEDby cause,semaphore_latency,persistence_latency,lock_latency, then heap and GC. On the way, three traps make metrics lie: worker counters exported as delta (sorate()is nonsense; usesum_over_time()),le="1"matching nothing, and long polls showing up as a 60 s "p99". Capacity is the same idea turned around: convert business load into writes per workflow, compute each section's ceiling (pens, History CPU, disk commits, disk space, rate limits, workers), take the smallest, check it with one node dead, and plan peak at 60–70 % of it, because waiting grows asbusy ÷ (1 − busy). On our cluster the narrowest section was the disk, at 88 % busy. Then prove it with a step-ramp benchmark and find the knee. And if PostgreSQL is the limit, adding Temporal hosts makes things worse.
The page usually reads the same way: "workflows are slow". You open Grafana. The server exposes hundreds of metrics, each with labels for service, operation, namespace and task queue; the SDK exposes dozens more. Something is always red.
The two easy approaches both waste the first hour. Scrolling every dashboard until something looks wrong finds a CPU spike that wasn't the cause. Looking at CPU and memory tells you a machine is busy, not where a request spent its time.
What I want is a decision tree. A few numbers, asked in a fixed order, where the first ones split the problem into big, cheap halves (is the time in my workers or in the server?) and only then the detailed server metrics. This post is that tree, the traps that make the metrics lie, and the other side of the same coin: working out how much load the cluster can take before it gets slow.
If you're just setting up worker metrics, I wrote separately about getting SDK metrics out of many workers with Prometheus or OTLP. This post assumes the metrics are already flowing.
Two families of metrics
| Family | Comes from | Examples | Tells you about |
|---|---|---|---|
SDK metrics (temporal_*) | Your workers | temporal_activity_schedule_to_start_latency, temporal_worker_task_slots_available, temporal_activity_execution_latency | The task queue wait, worker slots, your activity code |
| Server metrics | Each Temporal role | service_latency, persistence_latency, semaphore_latency, lock_latency, cache_usage, service_errors_resource_exhausted, task_latency_* | Shards, the per-shard IO semaphore, caches, rate limiters, the database |
Server metrics. Every Temporal process (frontend, history, matching, worker) serves Prometheus metrics on its own port, set by global.metrics.prometheus.listenAddress in the static config, commonly :9090. Every role uses the same names; the service_name label tells them apart. Server counters and histograms are cumulative.
SDK metrics. The TypeScript workers emit metrics from the SDK core, configured once per process with Runtime.install({ telemetryOptions: { metrics: ... } }): either a Prometheus endpoint the SDK serves itself (prometheus: { bindAddress: '0.0.0.0:9464' }) or an OpenTelemetry exporter (otel: { url, ... }). Names start with temporal_. Whether they arrive as delta or cumulative depends on the exporter and its temporality setting, and in our setup they're delta. That one detail breaks half the PromQL people copy from the internet. More on it below.
Metric names and labels move between releases on both the server and the SDK, and SDK histograms may carry a unit suffix (..._seconds_bucket). Before building a dashboard or alert, I grep the real thing on each role and on a worker:
curl -s http://<history-host>:9090/metrics | grep -v '^#' | cut -d'{' -f1 | sort -u | grep -iE 'latency|exhausted|shard'
curl -s http://<worker-host>:9464/metrics | grep -E '^temporal_(activity|worker|workflow)' | cut -d'{' -f1 | sort -u
The four-number triage for "Temporal is slow"
1. SCHEDULE-TO-START (SDK)       high? ──▶ the wait is on the task queue
       │                                      │
       │ low                                  ▼
       │                              2. SLOTS AVAILABLE (SDK)
       │                                 0 on all workers → workers full: add slots/workers,
       │                                                       or the activity is slow (go to 3)
       │                                 free slots          → check pollers: 0? wrong queue name?
       │                                                       same delay on EVERY queue? → server dispatch (4)
       ▼
3. ACTIVITY EXECUTION LATENCY (SDK)
       high? ──▶ YOUR code or what it calls (API, DB). Not Temporal.
       │ low
       ▼
4. SERVER LATENCY (service_latency by operation, e.g. StartWorkflowExecution)
       high? ──▶ look inside the server, in this order:
                 • service_errors_resource_exhausted by cause  → a rate limiter
                 • semaphore_latency p95                      → the per-shard IO semaphore
                 • persistence_latency p99 by operation       → the database/disk
                 • lock_latency p99                           → one hot workflow
                 • cache_usage + memory_heap + CPU            → GC thrash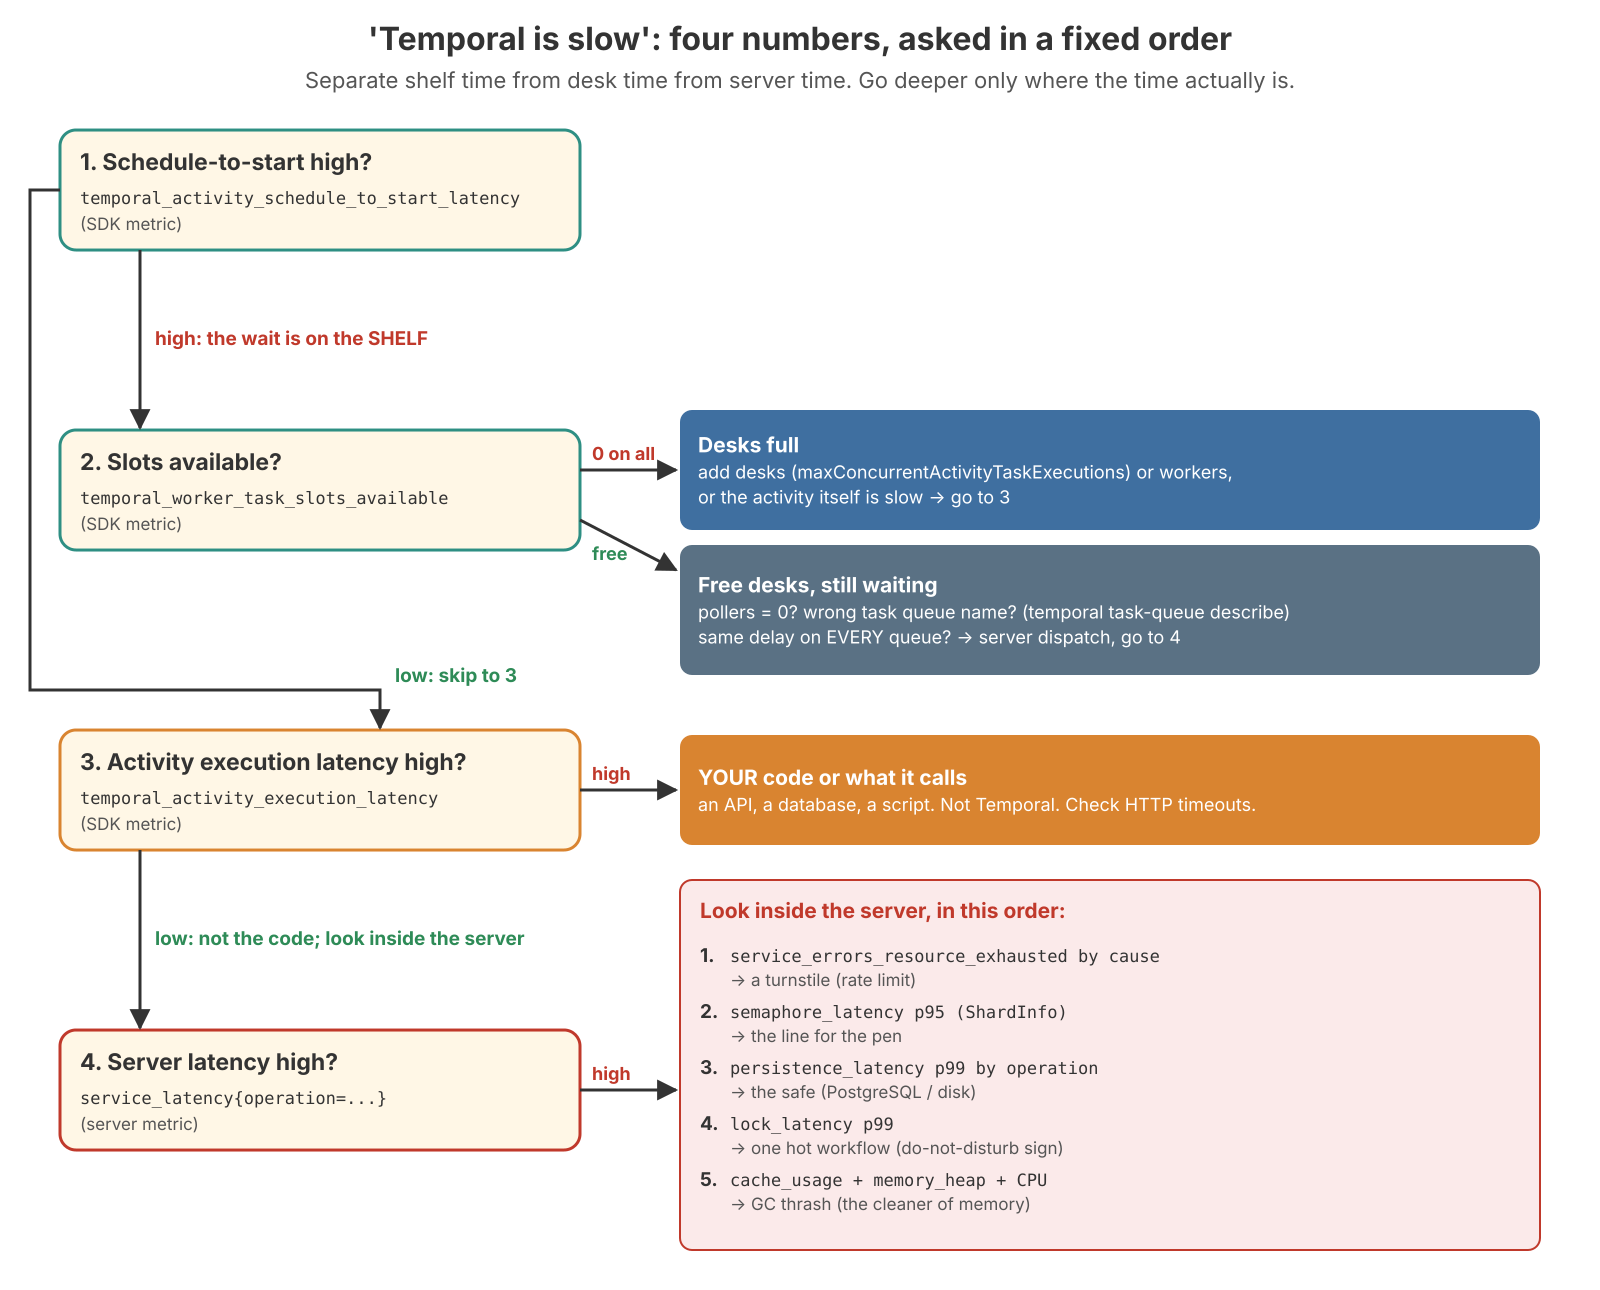
The sentence I keep in my head: first separate queue time from worker time from server time, then go deeper only where the time actually is.
Why this order
- Schedule-to-start first, because it's the one number that says whether a task is waiting or being worked on. Your worker measures it, so it covers every hop between "History scheduled the task" and "my worker picked it up".
- Slots second, because the most common cause of a long queue wait is that every execution slot is taken. It's also the cheapest fix, and it lives in your app, not the server.
- Activity execution latency third, because if the work itself is slow, the problem is your code or what it calls. Temporal can't make a third-party API faster.
- Server latency last, because only now do you know the time is really inside Temporal.
The same ordering logic applies to scaling decisions generally: check SDK workers first (most common, cheapest to fix), and check PostgreSQL before scaling any Temporal role, because scaling Temporal in front of a saturated database makes things worse (more on that in the capacity half).
The four numbers as PromQL
Our worker counters and histograms are delta, so these use sum_over_time. If yours are cumulative, swap in rate.
# 1. Schedule-to-start p95, per task queue (activities; the workflow-task version is the same shape)
histogram_quantile(0.95,
  sum by (le, task_queue) (sum_over_time(temporal_activity_schedule_to_start_latency_bucket[5m])))
histogram_quantile(0.95,
  sum by (le, task_queue) (sum_over_time(temporal_workflow_task_schedule_to_start_latency_bucket[5m])))

# 2. Free slots per worker type and queue (a gauge: no rate, no sum_over_time). 0 = saturated
min by (task_queue, worker_type) (temporal_worker_task_slots_available)

# 3. How long the work itself takes, per activity type
histogram_quantile(0.95,
  sum by (le, activity_type) (sum_over_time(temporal_activity_execution_latency_bucket[5m])))

# 4. Server latency per operation (cumulative server histogram: rate is fine). Exclude polls
histogram_quantile(0.99,
  sum by (le, service_name, operation) (rate(service_latency_bucket{operation!~".*Poll.*"}[5m])))
When schedule-to-start is high: my workers or the server?
This is the branch I go down most often, and it splits cleanly:
| What you see | Meaning | Fix |
|---|---|---|
| Slots exhausted, worker CPU/memory near the limit | Workers are genuinely full | Scale workers |
| Slots exhausted, worker CPU low | Slots are held by I/O-bound activities waiting on something downstream | Raise slots if the downstream can take it, or fix what the activities wait on |
Slots free, pollers starved (few pollers vs partitions, temporal_long_request_failure, Frontend ConcurrentLimit) | Workers aren't asking for work fast enough | More pollers or poller autoscaling; check frontend.namespaceCount and the load balancer idle timeout |
| Slots free, pollers healthy | The delay is inside the server | History transfer-queue lag (task_latency_queue), Matching backlog and sync-match ratio, or PostgreSQL under Matching (persistence_latency for CreateTasks / GetTasks / UpdateTaskQueue) |
The trap here is adding Matching hosts because schedule-to-start is high while slots_available is 0. The queue is waiting for your workers; more Matching capacity changes nothing. The pairing worth memorising: high schedule-to-start plus high worker CPU/memory means scale workers; high schedule-to-start plus low worker CPU/memory means more pollers or slots. (How Matching, partitions and pollers actually work is in the Matching and workers post.)
A concrete version of the "slots exhausted, CPU low" row: schedule-to-start is 3 s on an email queue only, every email worker shows 0 free slots, and worker CPU is 4 %. Email activities spend their time waiting on the provider, so every slot stays busy, pollers stop asking for work (a poller only reaches out when a slot is free), and new tasks sit on the queue. temporal_activity_execution_latency for those activities confirms it. If the provider can take more parallel calls, raise maxConcurrentActivityTaskExecutions or add workers; CPU has plenty of room. If the provider itself got slow or is rate-limiting you, more slots just pile more load on it. Fix the HTTP timeout and the provider side instead.
Inside the server: five checks, in order
You only get here when number four says the server's own latency is high. The order goes from "the server is refusing work on purpose" to "the server is struggling".
1. A rate limiter said no: service_errors_resource_exhausted by cause
Frontend and History count every rejection, labelled with the cause: RpsLimit, ConcurrentLimit, PersistenceLimit, BusyWorkflow, and others. The SDK quietly retries these with backoff, so users see slow, not errors. That makes this the single most useful "why is it slow but nothing's failing" metric.
# Label values are CamelCase in current versions; verify with
#   count by (resource_exhausted_cause) (service_errors_resource_exhausted)
sum by (service_name, resource_exhausted_cause) (rate(service_errors_resource_exhausted[5m]))RpsLimit/ConcurrentLimiton Frontend → a namespace or host rate limit. The per-host limit is divided by the number of frontends (the Frontend post covers that division).PersistenceLimiton History →history.persistenceMaxQPS(9,000 per History host by default on current versions) is lower than the database calls your traffic needs. History is throttling its own DB calls.BusyWorkflow→ one workflow is getting more updates than it can take (check 4).
Worked example: schedule-to-start is fine, slots are free, but StartWorkflowExecution p99 is 2 s and PersistenceLimit is climbing. Compare history.persistenceMaxQPS × History hosts against sum(rate(persistence_requests{service_name="history"}[5m])). If PostgreSQL has headroom (check persistence_latency and DB CPU/IOPS first), raise it, or use history.persistenceGlobalMaxQPS so the total doesn't change when the host count does. If PostgreSQL is already the wall, raising the limit only moves the queue into the database.
2. Waiting for the shard's IO slot: semaphore_latency
Each History shard has a small number of concurrent persistence slots, history.shardIOConcurrency, default 1. Every write to any workflow on that shard needs one. When writes queue for it, the wait shows up here.
# Waiting for the per-shard IO semaphore; per host, there is NO shard_id label
histogram_quantile(0.95, sum by (le, instance) (rate(semaphore_latency_bucket{operation="ShardInfo"}[5m])))
High here while persistence_latency is fast and stable means the cluster is shard-IO bound: writes are serialising on the semaphore, not waiting on the database. The mechanism and the fix are in the shards and shard IO concurrency post.
3. The database: persistence_latency by operation
# DB round-trip as seen by Temporal (includes connection-pool wait), by operation
histogram_quantile(0.99, sum by (le, operation) (rate(persistence_latency_bucket{service_name="history"}[5m])))
Rising on all operations at once means the database (or its disk, or the network to it) is the wall. Rising on one operation means a table problem, typically bloat on timer_tasks, transfer_tasks or tasks. Note that this number includes waiting for a connection from Temporal's own pool, so a too-small maxConns shows up here too. The tables themselves are covered in the PostgreSQL persistence post.
4. One hot workflow: lock_latency
Only one update to a given workflow runs at a time, behind a per-workflow lock. If thousands of signals hit one workflow ID, they queue for that lock.
# Name varies by version (lock_latency / cache_latency); grep for it
histogram_quantile(0.99, sum by (le) (rate(lock_latency_bucket{service_name="history"}[5m])))
sum(rate(service_errors_resource_exhausted{resource_exhausted_cause="BusyWorkflow"}[5m]))
More hosts can't fix this. One workflow lives on one shard behind one lock. The fix is workflow design: batch signals, or split the entity across several workflow IDs.
5. GC thrash: cache_usage, memory_heap, CPU
History keeps a mutable-state cache in RAM. If it's too big for the memory available, Go's garbage collector runs constantly and eats CPU, and it looks like a capacity problem when it isn't.
max by (instance) (memory_heap{service_name="history"})                              # verify the name on /metrics
histogram_quantile(0.99, sum by (instance, le) (rate(memory_gc_pause_ms_bucket[5m]))) # histogram or summary, by config
sum by (instance) (rate(process_cpu_seconds_total{job="temporal-history"}[5m]))      # the job label is yours
The three memory incidents that look alike (and aren't) are in the persistence and memory post.
The traps that make metrics lie
| Trap | What goes wrong | Do this instead |
|---|---|---|
| Worker metrics are delta | rate() and increase() return made-up numbers | sum_over_time() on worker counters; rate() is fine on server metrics |
le labels are floats | le="1" matches nothing: empty graph, no error | Write le="1.0" |
| Task queue labels are sanitised | - becomes _ in labels, so describe on the label spelling shows a false "0 pollers" | Take queue names from worker config or the CLI, never from labels |
| Averages | An average hides the slow tail (the fsync stalls) | Always p95/p99 from histograms |
| Long polls | A poll waits up to ~60 s by design, so "Frontend p99" is just the poll timeout | Exclude .*Poll.* from every latency panel and alert |
Delta vs cumulative
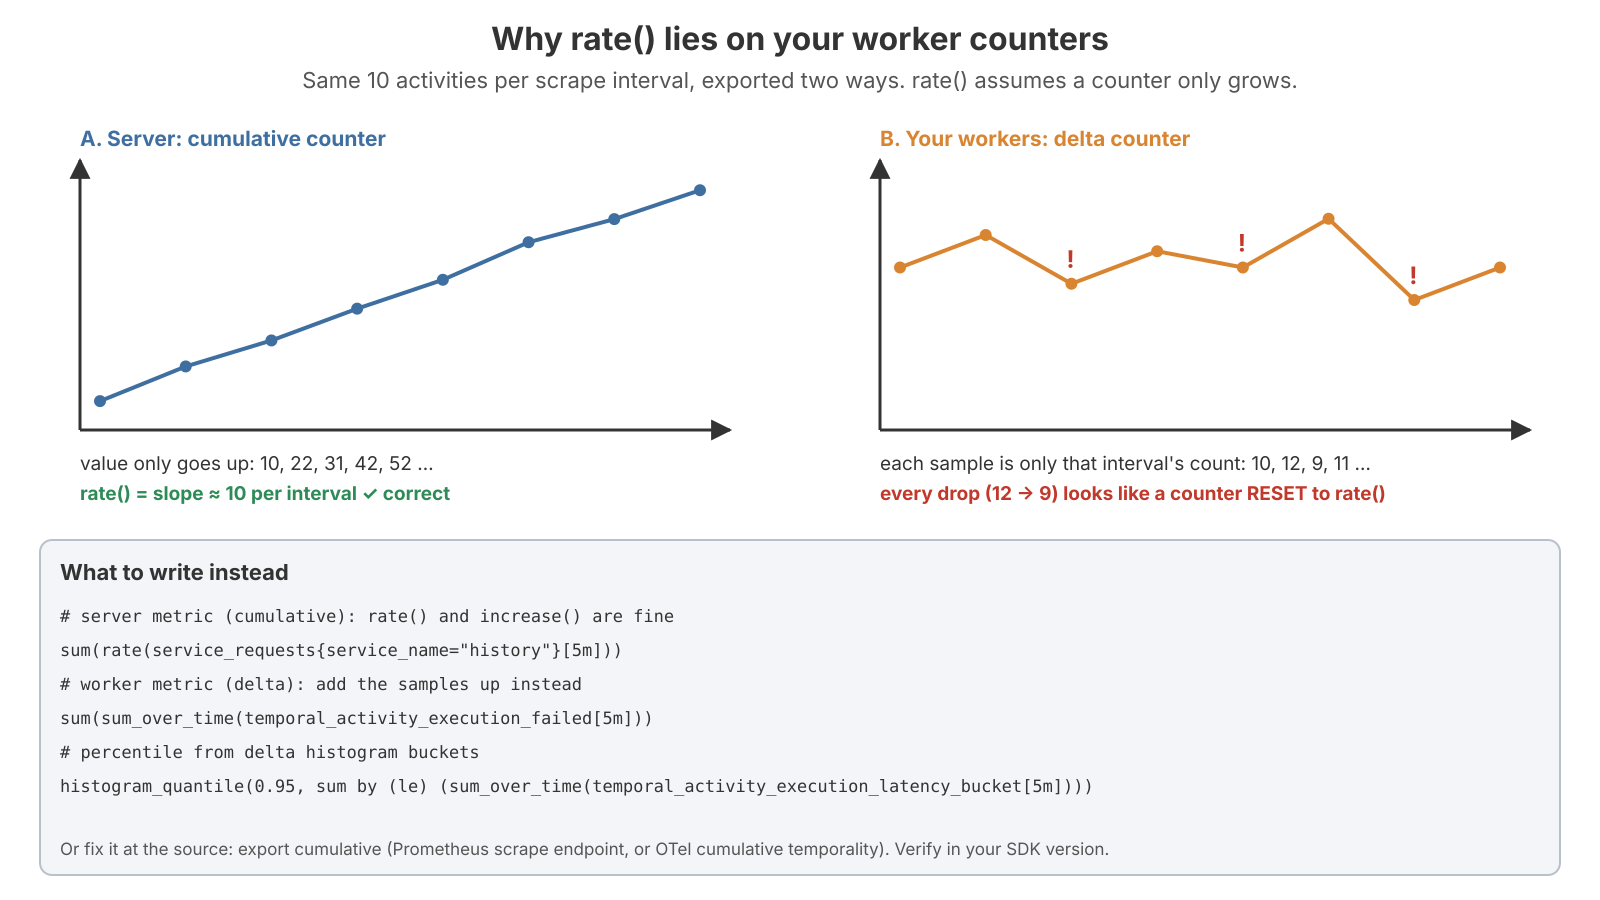
rate() and increase() assume a counter only ever grows. On a delta series each sample is just that interval's count, so the line goes up and down. Every drop is read as a counter reset, and the result is nonsense. On delta series, add the samples up instead:
# delta counter: add the samples up
sum(sum_over_time(temporal_activity_execution_failed[5m]))
# delta histogram: percentiles from summed buckets
histogram_quantile(0.95, sum by (le) (sum_over_time(temporal_activity_execution_latency_bucket[5m])))
Or fix it at the source: export cumulative (the SDK's Prometheus endpoint, or OTel with cumulative temporality) and keep using rate() everywhere. Pick one and write it on the dashboard so the next person doesn't have to rediscover it.
The histogram_quantile pattern I reuse for everything has three rules: keep le in the by (...), add any label you want one line per (operation, instance), and put either rate (cumulative) or sum_over_time (delta) inside, never neither.
A panel that's empty with no error is almost always one of three things: le="1" instead of le="1.0" (and you normally shouldn't filter on le inside histogram_quantile at all), rate() on a delta histogram, or a unit suffix you didn't know about (..._seconds_bucket).
The queue that had "0 pollers"
This one nearly cost me a false outage during a deploy. I copied a task queue name from a Grafana label, something like orders_sync, and ran temporal task-queue describe --task-queue orders_sync. Zero pollers. Workflows were progressing fine. The real queue was orders-sync; the metrics pipeline had cleaned - to _, and orders_sync was a different, empty queue that nobody polled.
# Describe it by its REAL name, not the label spelling
temporal task-queue describe --task-queue orders-sync
More server-side traps
- Shard metrics have no
shard_idlabel.semaphore_latency{operation="ShardInfo"},numshards_gaugeand friends are per host. You find the hot host, not the hot shard. - Empty polls are fine when idle. A high
poll_timeoutsrate means workers are waiting for work. state_transition_countis a histogram._countcounts updates (one per History transaction), while_sumadds up the transitions in each update. Grep what your version records and use one series consistently.- Rates need two samples in the window. With a 1 m scrape interval,
rate(x[1m])is often empty. Use at least 4× the scrape interval.
What to watch, and the thresholds
Temporal publishes no alert thresholds. Everything below is either a starting point (a generic operational guess so you have an alert on day one) or benchmark-derived (from your own load test: your normal plus a margin, or a fraction of your measured knee). The plan is to replace the first kind with the second.
| Metric | Role | Starting threshold | Action |
|---|---|---|---|
service_latency p99 by operation | All | Over 2× benchmark baseline for 10 m (benchmark-derived) | Compare roles: the first one to slow down is upstream of the problem |
service_errors_resource_exhausted by cause | Frontend / History | Sustained over 1/s for 10 m | The cause picks the branch |
persistence_latency p99 by operation | All | Over 100 ms on write ops for 10 m | PG commit latency/CPU/IO; if PG is fine, network and pool waits |
persistence_errors | All | Any sustained | Page. PG health, failover state, max_connections |
task_latency_queue p95 by task type | History | Over 5 s for 15 m | Timers and transfers are late: History CPU vs shard IO vs PG |
sharditem_created_count, shard_closed_count | History | Above 0 outside deploys | Membership churn: ports, clock, GC pauses, a flapping host |
poll_success_sync ÷ poll_success | Matching | Under 80 % on a normally-synced queue | Workers short, or partition starvation |
temporal_*_schedule_to_start_latency | SDK | p99 over 1 s on latency-sensitive queues | The triage tree, step 2 |
temporal_worker_task_slots_available | SDK | 0 for 10 m | Raise slots if CPU allows, else add workers |
| PG connections, replication lag, dead tuples on queue tables | PostgreSQL | Connections over 80 % of max; lag over 10 s; dead tuples growing for hours | Autovacuum tuning on queue tables |
The smallest dashboard that's actually useful is two rows: the four triage numbers, then the five server checks. Everything else is drill-down.
The second half of this post is the same machinery pointed the other way. Instead of "where is the time going now?", it's "how much can this cluster take before the time starts going somewhere bad?"
Capacity: the smallest ceiling wins
The question usually arrives as "can the cluster handle Black Friday?" The honest first answer is that it depends on what your workflows do: steps per workflow (each step is about 2 commits), payload size (WAL volume), backlog vs sync match (every backlogged task adds a transaction), timers, signals and visibility usage, the disk's fsync latency, PostgreSQL config, and the Temporal version. Together those swing the cost per workflow by 10× or more. That's also why borrowed figures ("~4,500 state transitions/s on Postgres after tuning") are at best an order-of-magnitude sanity check, never a sizing input.
The principle underneath is simple. A cluster is a pipe made of sections: Frontend, History, Matching, the database disk, your workers. The narrowest section sets the flow. Widening any other section only moves where the water waits. So capacity planning is three steps:
- Turn business load into resource load: workflows/s → database writes/s → CPU, disk.
- Work out each section's ceiling.
- The smallest ceiling is your capacity. Then check it still holds with one node down (N−1).
The unit of capacity: writes per workflow
You can't plan in "requests per second". A start request for a 3-step workflow and one for a 300-step workflow are the same request and a 100× different load. Plan in state transitions (writes) per second at a latency target.
Measure writes per workflow on your own cluster, per workflow type:
# Shard-IO writes per started workflow
  sum(rate(persistence_requests{service_name="history", operation=~"CreateWorkflowExecution|UpdateWorkflowExecution"}[1h]))
/ sum(rate(service_requests{service_name="frontend", operation="StartWorkflowExecution"}[1h]))
One trap here: Prometheus regex matchers are anchored. My own notes first had operation=~"Create|Update.*Execution", and Create alone only matches an operation literally named Create. Spell the operation names out, and add any other write operations your version shows (the task-adding ones, for example) if you want them counted. Also, long-running workflows keep writing long after they start, so measure over a window that covers whole workflows, or count state transitions directly.
From reading the persistence path, one workflow with one activity is about 7 state transitions and about 13 main-DB commits. So 1,000 of those per second is about 13,000 commits/s. That number, not "1,000", is what the disk sees.
The ladder of ceilings
| # | Ceiling | How to compute it | Notes |
|---|---|---|---|
| 1 | Shard IO slots | shards × shardIOConcurrency ÷ time each write holds a slot | Little's law |
| 2 | History CPU | ops/s per core × cores on the surviving nodes | We measured ~185 ops/s per core |
| 3 | Disk commits | What the disk can fsync per second | Flush latency matters more than headline IOPS |
| 4 | Disk space | daily data × retention days, plus room for pg_repack (≈ table size) | |
| 5 | Rate limits | per-host limits × surviving hosts | Per-host limits shrink when a host dies |
| 6 | Workers | slots × workers ÷ activity duration |
Two things to notice. "Surviving nodes" appears in rows 2 and 5: a ceiling that only holds when everything is up isn't one you can plan on. And row 3 belongs to the database, not History. Losing a History node doesn't change the disk's load at all. Losing the database is a different drill.
Never plan for 100 %
When a resource gets busy, waiting time doesn't grow evenly; it explodes near 100 %. The simplest single-queue model (a rule of thumb, not a law of Temporal):
wait ≈ service time × busy ÷ (1 − busy)

busy 50 % → wait ≈ 1× the work time
busy 80 % → wait ≈ 4×
busy 90 % → wait ≈ 9×
busy 97 % → wait ≈ 32×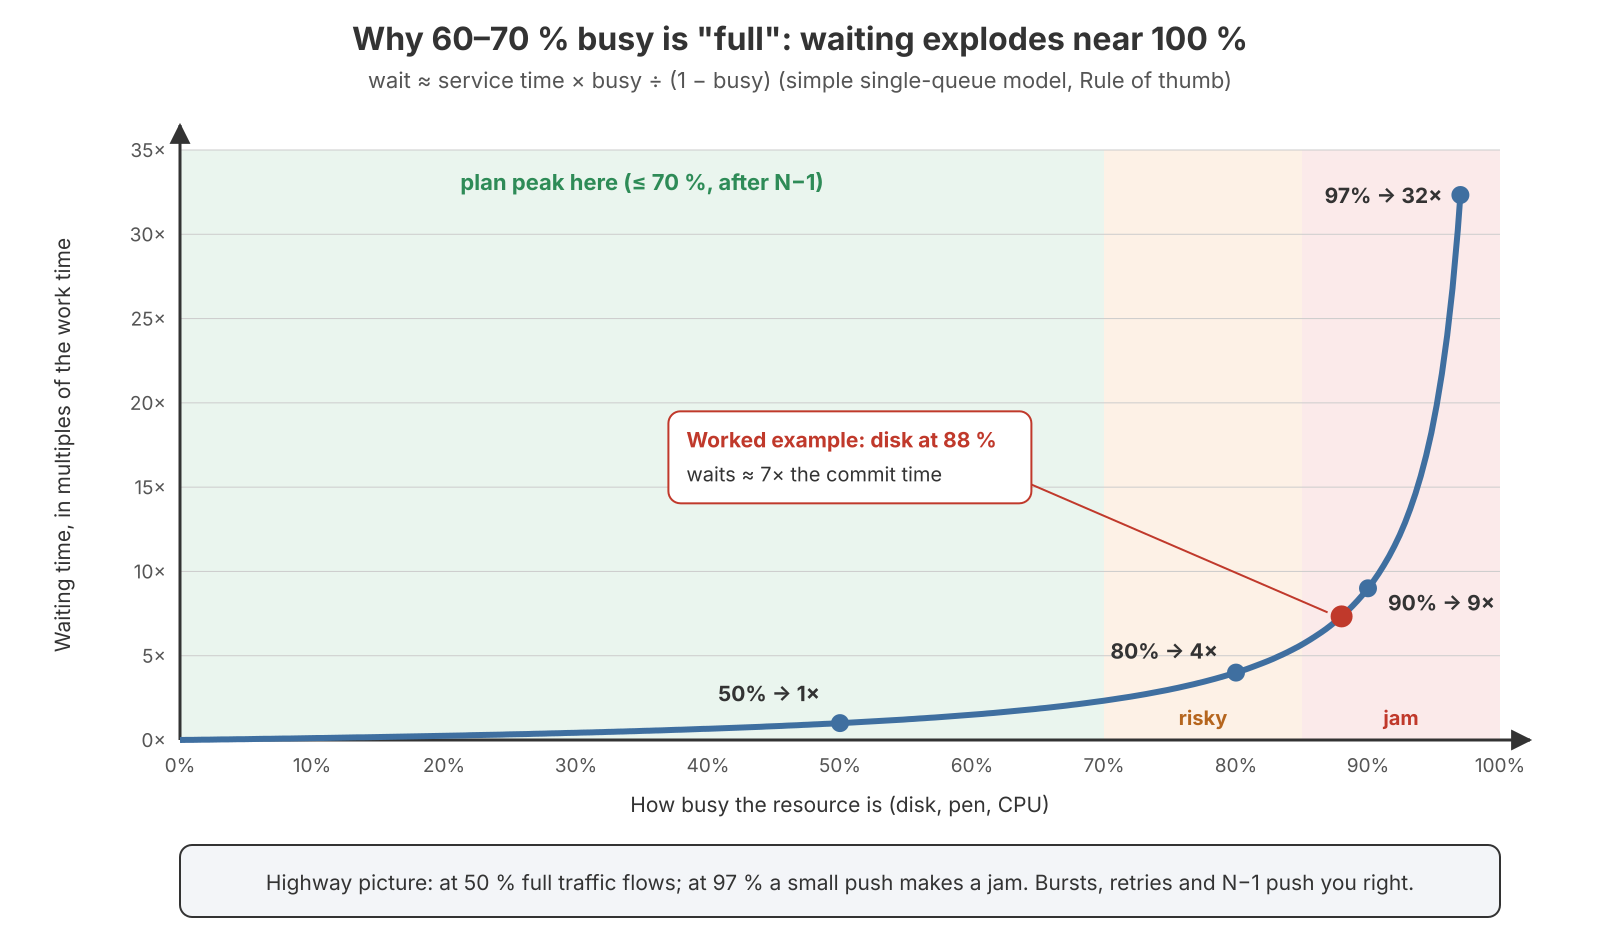
So my rule is: plan peak load at 60–70 % of the smallest ceiling, after removing one node. You'll also see "operate at 50–60 % of the knee" later. They don't conflict. The first is measured against a raw ceiling computed on paper (IOPS, cores); the second against a benchmark knee, which is already below the raw ceiling because queueing starts well before 100 %. Both are common operational starting points, not Temporal-published numbers.
The headroom isn't waste. It absorbs N−1 (one of 4 History hosts dies and the other 3 take +33 % each, plus a cache reload storm), shard movement during deploys, retries and timer catch-up after an incident, PostgreSQL vacuum and retention-delete waves, backups, and the fact that your busiest minute isn't your average.
Worked example: our real numbers
Business target: 3,000 workflows per minute, so 50/s. Measured cost: about 12 shard-IO writes per workflow, so 600 writes/s.
| Ceiling | Capacity | Usage at 600/s | Verdict |
|---|---|---|---|
| Shard IO: 512 shards × 4 slots ÷ 13 ms | ≈ 157,000 writes/s | 0.4 % | Not a concern |
| History CPU at ~185 ops/s per core | 600 ÷ 185 ≈ 3.2 cores needed on survivors | depends on host size | Fine if N−1 has spare cores |
| Disk (a P30-class managed disk) | ≈ 685 commits/s | 600 ÷ 685 ≈ 88 % | Too hot: queueing explodes here |
| Disk space | daily GB × 7 days | n/a | Check it |
| Rate limits | per-host × surviving hosts | n/a | Check it |
| Workers | slots × workers ÷ activity duration | n/a | Check it |
The disk is the narrowest section. At 88 % busy, the curve says waits are about 7× the commit time, and small bursts become big stalls. Checking it the other way: 685 commits/s ÷ 12 writes ≈ 57 workflows/s ≈ 3,400/min at 100 % busy, and ≈ 2,400/min at the 70 % plan line. That matches our real capacity model, which put the disk ceiling around 3,300–4,500 starts/min: the 3,000/min peak fits, but tight. Before taking on more, we'd want a faster disk tier (or WAL on its own disk), or fewer writes per workflow.
Notice what wasn't the problem. On an older cluster with 4 shards and 1 IO slot each at ~10 ms per write, the shard-IO ceiling was ~400 writes/s against ~350/s of demand: 97 % busy, and workflow starts went from 46 ms to 1.4 s. At 512 × 4 the slots moved out of the way and the disk became the narrowest section. The bottleneck moves when you fix one. That's normal, and it's why "add more shards" would not have helped here.
The fixes map one-to-one onto the ladder: shardIOConcurrency (then more shards, which means a new cluster) for the IO slots; a faster disk tier, a separate WAL disk or PostgreSQL tuning for the disk; more or bigger History hosts for CPU; global rate limits instead of per-host ones; more slots or worker processes for workers. And one lever widens every section at once: fewer writes per workflow, via local activities for short steps, fewer and larger activities, batched signals and smaller payloads.
Prove it with a step-ramp benchmark
Numbers on paper are a hypothesis. The benchmark turns them into facts.
Build staging to match production
The benchmark is only as good as its likeness to production. Match the Temporal version and dynamic config; numHistoryShards (immutable, and a 512-shard benchmark says nothing about 4096); shardIOConcurrency, persistence QPS limits and maxConns; the PostgreSQL version, instance class, storage type and IOPS tier and postgresql.conf; whether there's a synchronous standby (a network round trip on every commit); the network path to PostgreSQL (PgBouncer? TLS? same zone?); where visibility lives; and History host size and count.
The disk tier matters as much as the shard count: it sets fsync latency, which sets commit time, which sets how long each shard IO slot is held, which sets the knee. A benchmark on a faster disk shows a knee production can never reach.
The load generator and workers must not be the bottleneck. Give them their own machines and check they're relaxed: worker CPU under ~60 %, free slots, low schedule-to-start at low load.
Choose the workload and ramp it
I use omes, Temporal's load generator. Pick the scenario closest to production (go run ./cmd/omes list-scenarios), or write one with your real payload sizes. Run two profiles: your typical mix and your worst realistic one.
# Workers on dedicated machines (same run-id = same task queue)
go run ./cmd/omes run-worker   --run-id cap-step-200 --language go --server-address temporal-staging:7233 --namespace bench
# Offered load: 200 new workflows/s for 15 minutes
go run ./cmd/omes run-scenario --scenario workflow_with_single_noop_activity --run-id cap-step-200 \
  --server-address temporal-staging:7233 --namespace bench \
  --duration 15m --max-iterations-per-second 200 --max-concurrent 5000
The flags move between commits, so check run-scenario --help on the one you're using.
- Ramp in doubling steps, then refine: 25 → 50 → 100 → 200 → 400 → 800 workflows/s, then fill in between the last good step and the first bad one.
- Hold each step 10–15 minutes. That covers 2–3 checkpoints (
checkpoint_timeoutdefaults to 5 min), several autovacuum cycles, and History's shard-info save interval. Annotate step boundaries in Grafana. - Soak at the operating point for hours afterwards, ideally across a scaled-down retention boundary. Bloat, vacuum debt and WAL archive backlog only appear over time.
Record per step
From Temporal: achieved state_transition_count rate, service_latency and persistence_latency p99 per operation, RESOURCE_EXHAUSTED by cause, semaphore_latency, SDK schedule-to-start, the sync-match ratio, and CPU/heap/GC per host. From PostgreSQL, a snapshot at each step boundary that I diff:
SELECT now() AS ts,
       (SELECT xact_commit FROM pg_stat_database WHERE datname='temporal')          AS commits,
       (SELECT blks_hit::float/nullif(blks_hit+blks_read,0) FROM pg_stat_database WHERE datname='temporal') AS hit_ratio,
       (SELECT wal_bytes FROM pg_stat_wal)                                           AS wal_bytes,
       (SELECT wal_fpi   FROM pg_stat_wal)                                           AS wal_fpi,
       (SELECT count(*) FROM pg_stat_activity WHERE datname='temporal' AND state='active') AS active,
       (SELECT count(*) FROM pg_stat_activity WHERE datname='temporal' AND wait_event_type IN ('Lock','LWLock','IO')) AS waiting,
       (SELECT count(*) FROM pg_stat_activity WHERE datname IN ('temporal','temporal_visibility')) AS conns;
The commit rate should come out at roughly 2 × state transitions/s; it's the unit PostgreSQL actually pays in. For commit and WAL flush latency, use pg_stat_statements on COMMIT (needs track_utility=on) and pg_stat_wal timing (needs track_wal_io_timing).
Find the knee
The knee is the first step where any of these happens:
- achieved state transitions/s stops following offered load (under ~90 % of expected);
- p99
service_latencyorpersistence_latencymore than doubles for a less-than-double load increase; service_errors_resource_exhaustedappears;- schedule-to-start or backlog grows without bound during the hold (still growing, not just higher);
- PostgreSQL shows saturation: CPU near 100 %,
WALSyncwaits dominating, requested checkpoints, orn_dead_tupclimbing step after step.
The resource at its limit at the knee is your weakest link, and it decides what you buy. Then operate at roughly 50–60 % of the knee: tighten toward 70 % only with fast autoscaling and well-understood traffic, loosen toward 40 % if a PostgreSQL failover must be absorbed without a backlog. After that, change one variable per run and re-ramp, keeping the results table in the repo next to the Helm or Terraform that produced it.
Sanity check: if the knee is 5,000 ST/s and production peak is 3,800, you're at 76 % of the knee. Losing a host, a vacuum wave or a retry burst puts you past it.
Deriving the numbers from the benchmark
History hosts
If History CPU or memory saturated first:
per_host_capacity = ST/s at the knee ÷ History hosts in the test
hosts_needed      = ceil( target_peak_ST/s ÷ (per_host_capacity × operating_fraction) ) + 1
Illustrative numbers: staging had 3 History hosts and the knee was 6,000 ST/s at 90 % CPU, so 2,000 ST/s per host. Production peak 9,000 ST/s at a 55 % operating fraction: 9,000 ÷ 1,100 = 8.2, so 9, plus one for N+1 = 10 hosts. Then re-check the database before buying anything: 9,000 ST/s is ~18,000 commits/s. If PostgreSQL was at 70 % at 6,000 ST/s, it won't do that.
The N−1 check in plain terms: every node must carry its share plus the dead node's share and still sit at or below ~70 %. Two 4-core History nodes needing 5 cores at peak is fine on a normal day and impossible when one dies (5 ÷ 4 = 125 %). The survivor saturates, its caches grow because it now holds every shard, SDK retries pile on, and latency explodes. Either each node carries all 5 cores alone at 70 % (≈ 8 cores each), or run three 4-core nodes (8 cores survive, 5 ÷ 8 ≈ 62 %).
Memory per host depends on the cache mode, which is version-dependent: from v1.25 one host-level cache (history.hostLevelCacheMaxSize, 128,000 entries) is shared by all shards on a host; up to v1.24 each shard has its own (history.cacheMaxSize, 512 entries), so memory grows with shards per host and losing a host can double a survivor's cache.
The Temporal docs give a starting ratio of 1 History process per 500 shards (4096 shards → about 8 processes). It's a first-deployment starting point, not a per-host limit; the knee decides. And before adding hosts, check shard balance (numshards_gauge), hot shards, cache hit rate and GC pauses, because adding hosts fixes none of those. One History host at 90 % CPU and three at 40 % is imbalance, not capacity. The cluster membership and scaling post goes into that.
shardIOConcurrency: raise until persistence p99 bends
Fix offered load just past the current knee, then sweep 1 → 2 → 4 → 8 (restarting each time, since it's read when a host acquires a shard):
| As you raise it | Meaning | Action |
|---|---|---|
semaphore_latency falls, ST/s rises, persistence_latency p99 flat | Shards were serialising; the DB had spare capacity | Keep it, try the next value |
ST/s flat, persistence_latency p99 rises, PG active backends and WALSync waits rise | The queue moved from Temporal's semaphore into PostgreSQL | Go back one step. This is the bend |
persistence_errors, timeouts or ShardOwnershipLost | Pool exhaustion or DB overload | Back off; check maxConns |
If going from 2 to 4 drops semaphore_latency but ST/s doesn't move and PG active backends double, go back to 2: you added concurrency without throughput. And if semaphore_latency stays high with PostgreSQL and History CPU both unsaturated even after raising it, the cluster needed more shards from the start. Better to learn that in staging, since the shard count can't change later.
Partitions per hot task queue
Benchmark one hot queue at the default 4 partitions and note where schedule-to-start rises or sync-match drops while workers still have free slots. That gives per-partition capacity, which replaces the forum's "~100 tasks/s per partition". Keep numTaskqueueReadPartitions and numTaskqueueWritePartitions equal in steady state (grow read first, shrink write first), and don't raise partitions on cold queues: pollers spread thinner and sync-match drops.
Connections: the budget that ties it together
Each server process opens a pool per datastore:
total_conns = Σ over processes ( default.maxConns + visibility.maxConns )
            ≤ max_connections − superuser_reserved − admin/monitoring
If maxConns is unset, Go's database/sql default applies: unlimited. A spike opens connections until PostgreSQL refuses them. Always set maxConns and maxIdleConns on every datastore.
Illustrative: 10 History × (50 + 10) + 3 Matching × (30 + 5) + 3 Frontend × (20 + 20) + 2 Worker × (10 + 10) = 600 + 105 + 120 + 40 = 865 connections. That's far more active backends than a single primary handles well. PostgreSQL throughput peaks at a modest multiple of its core count in active backends, then falls from lock and LWLock contention and context switching. The fix isn't raising max_connections; it's smaller pools, fewer hosts, or a pooler (I wrote up PgBouncer from first principles). Whether Temporal's postgres plugin works behind transaction-mode pooling depends on the server version, so verify yours before relying on it.
Is it Temporal or PostgreSQL?
Three signatures cover most of what I've seen.
History CPU 90 %, PostgreSQL CPU 30 %: History-bound. But confirm first: CPU uneven across hosts is imbalance; high memory_gc_pause_ms with a heap near its limit is GC (more memory or a bigger cache, not more hosts). If it checks out, add History hosts off-peak, one at a time, because ~1/N of shards move and PostgreSQL takes a cold-cache reload burst. Then verify PostgreSQL didn't tip into the next case.
History 30 %, PostgreSQL CPU 95 %, commit latency high: PostgreSQL-bound. Do not add Temporal hosts. In rough order of cost and benefit:
- Reduce writes per outcome: payload size, steps per workflow, chatty signals, backlog, visibility usage.
- Tune PostgreSQL for the workload:
max_wal_sizeandcheckpoint_timeout,wal_compression, per-table autovacuum on queue tables,shared_buffers,commit_delayfor group commit, fillfactor onexecutions. - Move visibility to its own instance.
- Scale PostgreSQL vertically, including a faster WAL device if
WALSyncwaits dominate. - Lower Temporal's pressure on purpose (
shardIOConcurrency,persistenceMaxQPS, per-namespace rate limits) so overload becomes controlledRESOURCE_EXHAUSTEDinstead of everything timing out.
Distinguish CPU-bound from flush-bound: 95 % CPU with mostly active backends and no wait event is CPU (queries, index maintenance, vacuum). Low CPU with high commit latency and WALSync / WALWrite waits is the disk. If a ramp shows ST/s going flat between two steps while persistence_latency p99 doubles and PostgreSQL sits at 45 % CPU with mostly WALSync waits, that's the WAL flush path, and more Temporal hosts or more DB CPU do nothing for it.
-- CPU-bound shows mostly no-wait 'active'; flush-bound shows WALSync/WALWrite
SELECT coalesce(wait_event_type,'CPU') AS wtype, coalesce(wait_event,'running') AS wevent, count(*)
FROM pg_stat_activity WHERE datname='temporal' AND state='active' GROUP BY 1,2 ORDER BY 3 DESC;
Matching 90 %, History 30 %, PostgreSQL 40 %: Matching-bound. Check pollers first. Huge worker fleets with many pollers each burn Matching CPU on poll churn; too few pollers push tasks into backlog (low sync-match, extra DB writes). Find whether one queue is hot (loaded_task_queue_partition_count per host, name version-dependent). One hot queue limited by its partitions → raise partitions on that queue. Many queues on too few hosts → add Matching hosts, which only help if there are enough partitions to spread.
The capacity chain, and why more servers can mean less throughput
A request passes Client → Frontend → History (and Matching) → PostgreSQL, and the work is done by your SDK workers polling through Frontend → Matching. The system goes as fast as its slowest link.
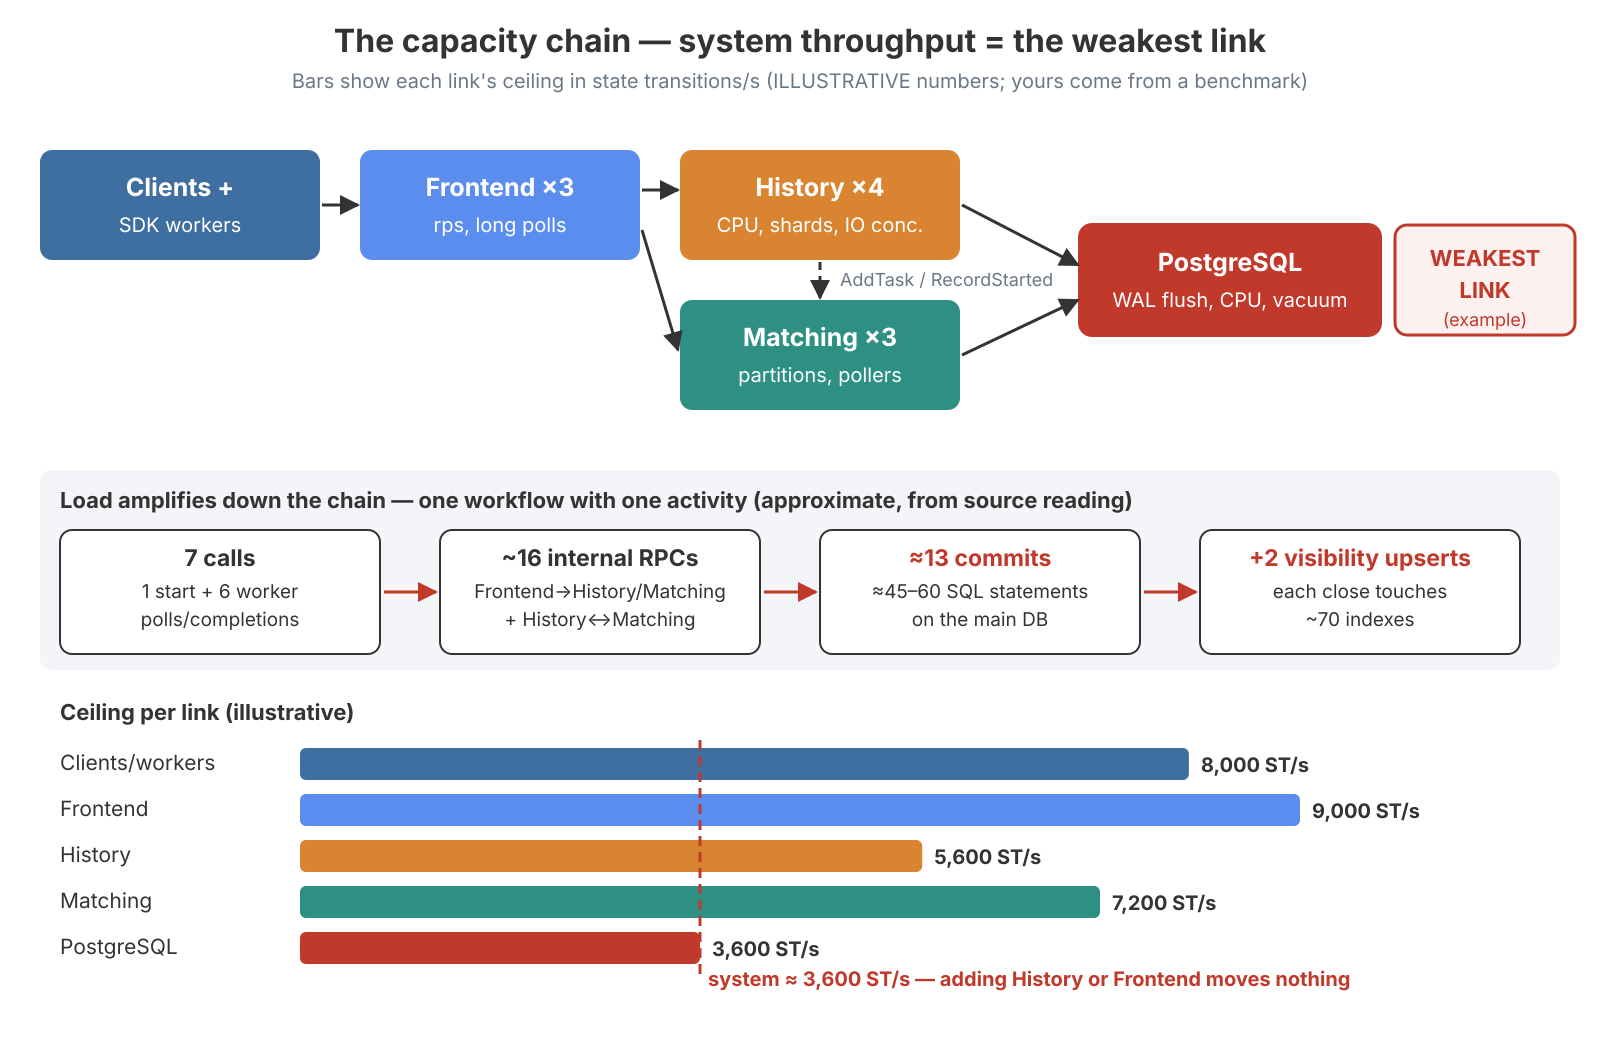
What makes the database the usual weakest link is amplification. For one workflow with one activity (approximate, from reading the source, sync match, cached):
| Layer | Calls for one workflow |
|---|---|
| Client → Frontend | 1 StartWorkflowExecution |
| Workers → Frontend | 6 (2 workflow-task polls + 2 completions + 1 activity poll + 1 completion) |
| Frontend → History / Matching | ~10 |
| History ↔ Matching | 3 add-task + 3 record-started |
| Temporal → main DB | ≈ 13 commits, ≈ 45–60 statements |
| Temporal → visibility DB | 2 upserts, the close touching ~70 indexes |
| Later, retention | ≈ 4 commits, ≈ 15 delete statements |
The client sends "1 workflow/s"; the database sees ~13 commits/s and ~50 statements/s, plus visibility. 10× the client traffic is 10× the fsyncs, and no Temporal-side scaling changes that ratio. Only changing what the workflow does does.
And this is the counter-intuitive part: when PostgreSQL is the weakest link, adding History (or all-role) hosts can make throughput worse:
- More connections on a saturated DB. Each new process brings its own pools. More active backends on a CPU- or lock-bound primary means more context switching and LWLock contention, so less total throughput.
- You remove the throttle that was protecting the DB.
history.persistenceMaxQPSis per host (9,000 on current versions). Going from 4 to 8 hosts doubles what Temporal will send before throttling itself, so thePersistenceLimityou were hitting disappears and the DB takes the full surge. - Shard movement. Adding a host moves ~1/N of the shards. Each moved shard bumps its
range_id, reloads its queue state and starts with a cold cache (around 9 SELECTs per workflow touched, plus history reads), and in-flight writes on the old owner fail withShardOwnershipLostand retry. All of it lands on the database that was already the bottleneck. - Cache splitting and per-host background load. The working set spreads thinner, hit rates drop, and queue polling, membership heartbeats and namespace refresh all scale with host count.
- Matching: hosts beyond the hot queue's partition count do nothing for that queue.
If the database is the limit, more Temporal servers just mean more clients queueing at it together, and it gets slower because more of them crowd it.
What I'd tell myself before go-live
- For "Temporal is slow": schedule-to-start, slots, activity latency, server latency, in that order. Only the fourth opens the server.
- Inside the server:
RESOURCE_EXHAUSTEDby cause,semaphore_latency,persistence_latency,lock_latency, heap/GC. - Know whether your worker metrics are delta or cumulative, and write it on the dashboard. Delta means
sum_over_time, neverrate. - Percentiles, not averages.
le="1.0", notle="1". Exclude polls from latency panels. Take queue names from config, not labels. - Every threshold is a starting point until your own benchmark replaces it. Temporal publishes none.
- Plan in writes per workflow, not requests. Set
maxConnsexplicitly on every datastore. - Plan peak at 60–70 % of the smallest ceiling after N−1, or 50–60 % of the benchmark knee.
- The paper numbers are a hypothesis; the knee is the fact. Benchmark on the same shard count and disk tier as production.
- Scale the weakest link only, then re-measure, because it will have moved. If PostgreSQL is full, more Temporal hosts make it worse.
Next in the series: cluster membership, horizontal scaling and which config you can and can't change later.