Why Temporal Exists, and the Four Services Behind Every Workflow Step
On this page
- The problem: forgetting where you were
- The event history
- The server never runs your code
- Replay, determinism, and at-least-once
- Four services, split by how they grow
- The mechanics every request shares
- Two kinds of task, served by long poll
- Every History save: an append, then one transaction
- Follow-up tasks: a transactional outbox
- Sync match, backlog, and the handshake
- Tracing one workflow
- Start
- Activity scheduled, started, completed
- Time is a row
- One hot workflow ID
- Count the trips
- Four patterns, and where to look
- What I'd tell myself before go-live
TL;DR: The Temporal server never runs your code. Your workers do. The server does two things only: it remembers (it appends every finished step, with its result, to an event history in PostgreSQL) and it hands out jobs (it puts workflow tasks and activity tasks on task queues for workers to long-poll). When a worker dies, another one replays the workflow code from the top and reuses the recorded results, which is why workflow code must be deterministic and every side effect belongs in an activity. Inside the server, four services split the work: Frontend (stateless front door), History (the only writer of workflow state, partitioned into shards), Matching (task queues), and the internal worker (Temporal's own housekeeping). Every workflow step is one History save on one shard: append events, then one transaction for the mutable state plus follow-up task rows that a background processor later delivers to Matching. A one-activity workflow costs about 7 transactions, and that arithmetic is why History plus PostgreSQL is almost always the bottleneck.
"Temporal is slow" is the sentence that starts most Temporal investigations, and it can mean very different things: the workers are out of slots, a History host is handing its shards over, PostgreSQL commits are slow, or one workflow ID is being hammered with signals. Each has a different fix, and none of them shows up clearly on a CPU graph. You can only tell them apart if you know the path a request takes: which service handles it, which rows it writes, and which background helper picks up the follow-up work.
This is the first post in Running Temporal Server in Production, a series about self-hosting Temporal Server on PostgreSQL, written from running it in production. The series goes through the machine (Frontend, History, shards, Matching, workers), how your code meets it (timeouts, retries, determinism), the PostgreSQL persistence layer and memory, metrics and capacity planning, cluster membership and scaling, and finally failure drills and a reference production architecture. It ends with a one-page cheat sheet.
This post lays the foundation: why Temporal exists, what the server actually does, and one request traced hop by hop with the database writes counted.
The problem: forgetting where you were
Take a boring job: send an invoice. (1) Render the PDF. (2) Email it to the client. (3) Mark it "sent" in the database.
The process crashes right after step 2. If it starts over, the customer gets two emails. If it gives up, the invoice is never marked sent. The root cause is that a normal program keeps "which step am I on?" in memory, and memory is gone when the process crashes, the pod is evicted, or pm2 restarts your Node app during a deploy.
Try to fix it yourself and you rebuild Temporal one piece at a time:
- Retry the whole thing: a crash after step 2 re-runs step 2 and sends a second email.
- Save progress in a table: the crash can land between "email sent" and "row updated". You also need each step's result (step 2 needs the PDF URL), not just "done".
- Add timers ("remind them if unpaid in 7 days"): you can't sleep for 7 days in memory, so you add a scheduled-jobs table, a cron, and locking so two crons don't fire the same reminder.
- Run on many machines: two copies grab the same invoice, so you add leases and owner columns.
You've now built a durable log of finished steps and their results, a scheduler for future work, a queue that hands work to machines, and locks so only one machine owns a job. That's Temporal. Every part of it exists to protect against a specific crash or race. When something later in this series looks overcomplicated, ask which crash it's protecting against. There's always one.
The event history
Temporal's version of the progress table is the event history: an append-only log of everything that happened to one workflow run. Each event has an increasing ID. The server writes it, workers read it, and nothing ever edits it. The easiest way to picture it is a friend with a notebook writing down every step you finish.
For the three-step invoice, a finished run looks like this (real event names):
| ID | Event | Meaning |
|---|---|---|
| 1 | WorkflowExecutionStarted | Someone asked for invoice 42 (with the input) |
| 2–4 | WorkflowTaskScheduled / Started / Completed | A worker ran the workflow code and decided: run makePdf |
| 5 | ActivityTaskScheduled | makePdf is waiting for a worker |
| 6 | ActivityTaskStarted | A worker ran it (written at the end, with the final attempt number) |
| 7 | ActivityTaskCompleted | Result = the PDF URL |
| 8–13 | decide, then sendEmail | Same six-event pattern |
| 14–19 | decide, then markSent | Same six-event pattern |
| 20–22 | WorkflowTaskScheduled / Started / Completed | Decide again: nothing left, finish |
| 23 | WorkflowExecutionCompleted | Done |
Three things are already visible:
- Results live in the history. Event 7 carries the PDF URL. That's how
sendEmailgets it after a crash. - The rhythm is "decide, do, decide, do, …, finish." The whole server architecture follows from it.
- 23 events for 3 business steps. Each is a database write somewhere. Keep that number in mind.
In PostgreSQL the events are stored in batches as encoded blobs in history_node, with branch metadata in history_tree. You read them with the CLI, not SQL:
# One workflow's history, event by event
temporal workflow show --workflow-id invoice-42 --namespace default

# Count events (replay cost grows with this number)
temporal workflow show --workflow-id invoice-42 --output json | jq '.events | length'

# Current summary: status, pending activities and their attempt counts
temporal workflow describe --workflow-id invoice-42
Besides the history, the server keeps a short mutable state per run: what's pending right now (activities, timers, children, signals), the next event ID, and the current workflow task. That's one executions row plus side tables, updated on every step. The history is for replay. Mutable state is what the server uses for its own quick decisions.
The server never runs your code
Here is the invoice in TypeScript:
// activities.ts: real side effects; may fail, may be retried
export async function makePdf(invoiceId: string): Promise<string> { /* render, upload, return URL */ return '...'; }
export async function sendEmail(invoiceId: string, pdfUrl: string): Promise<void> { /* call the mail API */ }
export async function markSent(invoiceId: string): Promise<void> { /* UPDATE invoices SET status='sent' */ }

// workflows.ts: only decides the order
import { proxyActivities } from '@temporalio/workflow';
import type * as activities from './activities';

const { makePdf, sendEmail, markSent } = proxyActivities<typeof activities>({
  startToCloseTimeout: '1 minute',      // how long one attempt may take
});

export async function sendInvoice(invoiceId: string): Promise<void> {
  const pdfUrl = await makePdf(invoiceId);   // step 1
  await sendEmail(invoiceId, pdfUrl);        // step 2
  await markSent(invoiceId);                 // step 3
}

// starter.ts: your app asks the server to start one run
await client.workflow.start(sendInvoice, {
  taskQueue: 'email_queue',       // the queue where tasks for this workflow are placed
  workflowId: 'invoice-42',       // business ID; unique per namespace while running
  args: ['42'],
});
The workflow decides the order of steps, activities touch the outside world, and both run inside your worker process (in my case Node apps under pm2). That leads to the idea the rest of this series is built on:
The Temporal server never runs your code. Your workers do. The server only remembers (writes the history to PostgreSQL) and hands out jobs (puts tasks on queues for workers to pick up).
The server never sees sendInvoice or sendEmail. It only sees what the worker sends back: "I decided to run sendEmail" and "sendEmail finished, here's the result". So you're operating two separate systems:
| Temporal server | SDK worker (your app) | |
|---|---|---|
| What it does | Remembers, hands out jobs, keeps time | Runs workflow and activity code |
| Deployed as | Infrastructure (temporal-server) | Application code (pm2, a k8s Deployment…) |
| Where it gets slow | History + PostgreSQL, Matching, Frontend limits | Too few pollers or slots, slow activities, CPU |
| What "down" means | Nothing moves; nothing committed is lost | Jobs wait in queues; the server is healthy but idle |
One useful consequence: if all your workers are down, the server keeps working. Timers still fire, signals are still recorded, new workflows are still accepted. Tasks wait until a worker comes back, and then the backlog drains in a burst. Nothing is lost, only paused.
The trap is that "Temporal is slow" often means "the workers are slow", and adding server hosts does nothing when workers have no free slots. Schedule-to-start latency rising while temporal_worker_task_slots_available sits at 0 is a worker problem. The metrics post in this series covers that triage in full.
Replay, determinism, and at-least-once
When a worker dies mid-workflow, the next one doesn't jump to step 4. It runs the workflow function from the top with the whole history in hand. That's replay.
Workers never write events. Running workflow code produces commands ("schedule activity sendEmail", "start a timer", "complete"), and the server turns commands into events. During replay, each time your code would produce a command, the SDK checks the next event in the history. If ActivityTaskScheduled(makePdf) and ActivityTaskCompleted(url) are already there, the SDK doesn't send the command. It resolves the await immediately with the saved URL. The first command with no matching event is new, so it goes to the server and real work starts.
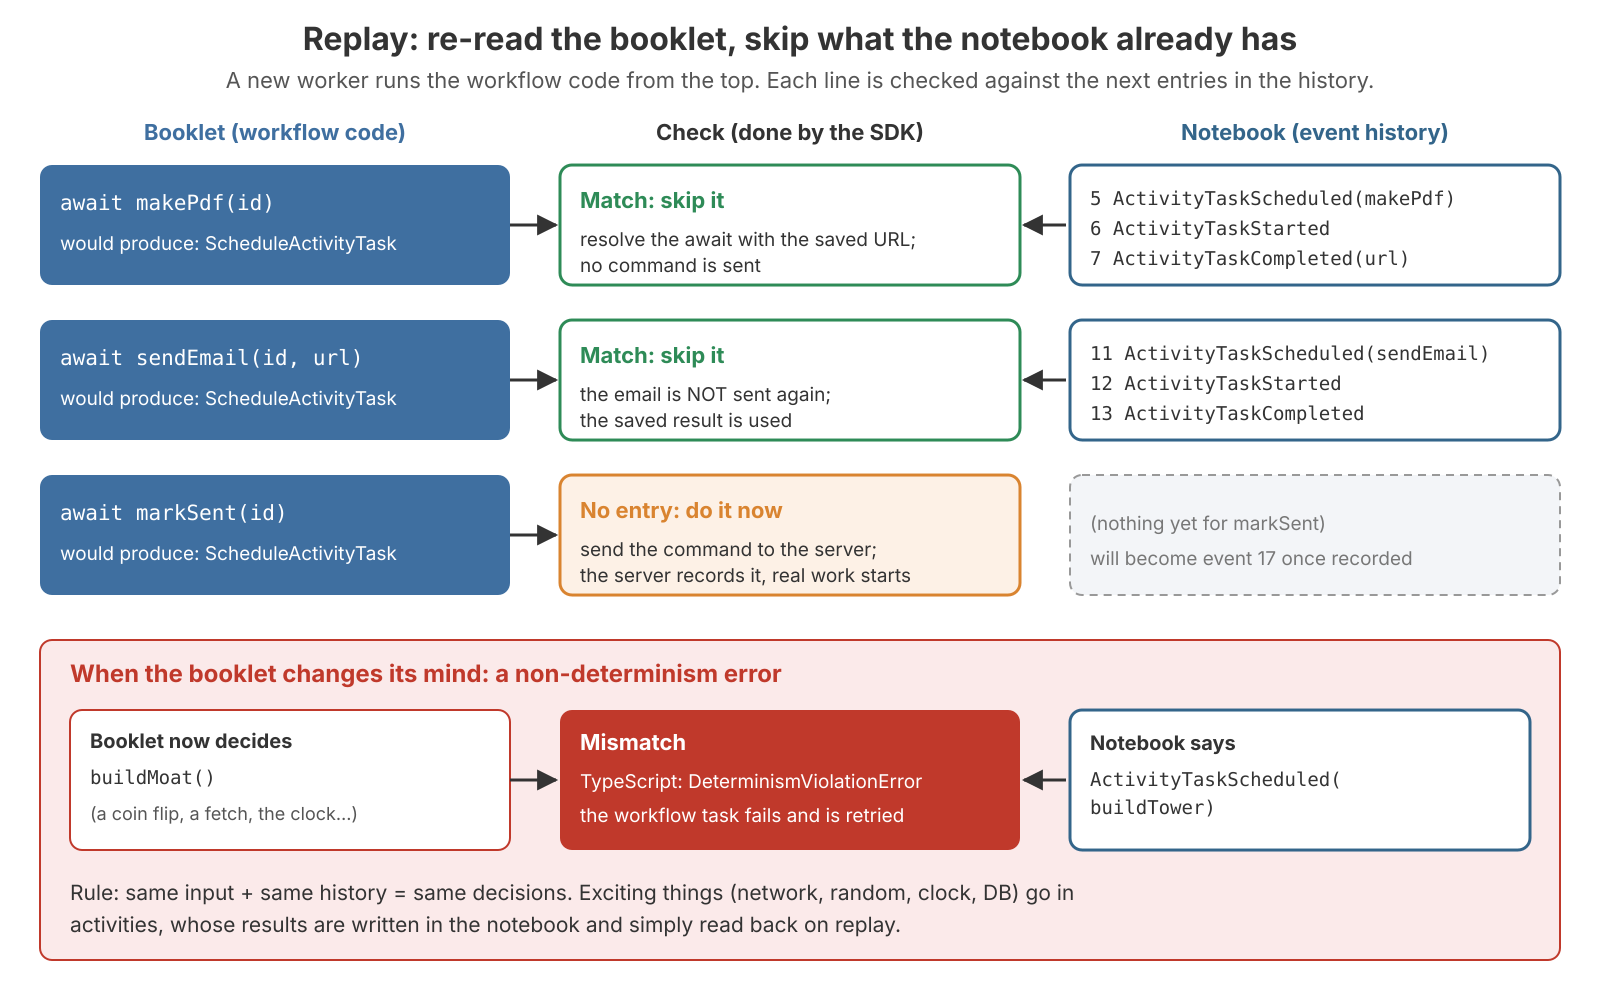
Replay runs on the worker, in memory, and is usually milliseconds for short histories. A worker that still has the run in its sticky cache skips it and only receives new events. Full replay happens after a restart, an eviction, or a handover to another worker, which is why a pm2 restart at peak makes workflow tasks slow for about a minute. Cost grows with history length, so a 50,000-event history is expensive to replay. That's one reason continue-as-new exists.
Replay only works if the code makes the same decisions every time. If the code flips a coin and it lands differently on replay, the code no longer matches the history, and you get a non-determinism error (NDE). So workflow code must be deterministic (no direct randomness, clock reads, API calls, or config that can change), and anything non-deterministic goes in an activity, whose result is recorded and read back. Waiting 7 days is fine in a workflow with the SDK's sleep(), because the server keeps the timer.
The TypeScript SDK sandboxes workflow code: Math.random() is seeded and Date.now() returns the workflow task's time, so both are safe, and network modules simply aren't available (exact behaviour depends on SDK version). On a mismatch it raises DeterminismViolationError and by default fails the workflow task, not the workflow. The server retries the task, so the workflow looks stuck rather than failed until you fix and redeploy. Versioning and patched() get their own post later in the series.
The history makes decisions exactly-once. It does not make the outside world exactly-once:
| Crash moment | History says | What happens next | Second email? |
|---|---|---|---|
Before sendEmail started | makePdf completed, nothing for sendEmail | Replay reaches sendEmail, finds no entry, schedules it | No |
While sendEmail runs | ActivityTaskScheduled(sendEmail), no completion | Server waits for the attempt's timeout, then retries | Possibly |
After sendEmail completed | ActivityTaskCompleted(sendEmail) | Replay reuses the result, schedules markSent | No |
The middle row is the real edge: activities are at-least-once. If the worker dies after the mail API accepted the message but before it reported "done", the server can't know the email left, so it retries. "Temporal is exactly-once" isn't a reason to skip an idempotency key on a charge-card activity. Pass a stable key (workflow ID + activity ID) to the provider, or check "already sent?" first.
The flip side is the rule the whole server is built on: nothing is confirmed until it's written to PostgreSQL. If the server crashes before confirming, the caller gets an error and retries. Server failures cost time, never data. "Paused, not lost" will come up in every failure scenario in this series.
Two settings shape the history directly. Workflows have no default retry policy (activities do, with unlimited attempts). History length and size are capped by limit.historyCount.warn / .error (10,240 / 51,200 events) and limit.historySize.warn / .error (10 MB / 50 MB). Those defaults are version-dependent, so check common/dynamicconfig/constants.go at your release tag and your own overrides.
Four services, split by how they grow
One process could do all of this, and on a laptop it works. In production the jobs grow differently: 2,000 polling workers need front-door capacity but not more history writing, and a burst of workflow steps needs the opposite. They also differ in state. The front door forgets everything after each request, but the history writer must never have two copies writing the same workflow. Put them in one process and every restart is as delicate as the most delicate part. So Temporal splits the server by how each job grows and what it has to remember.
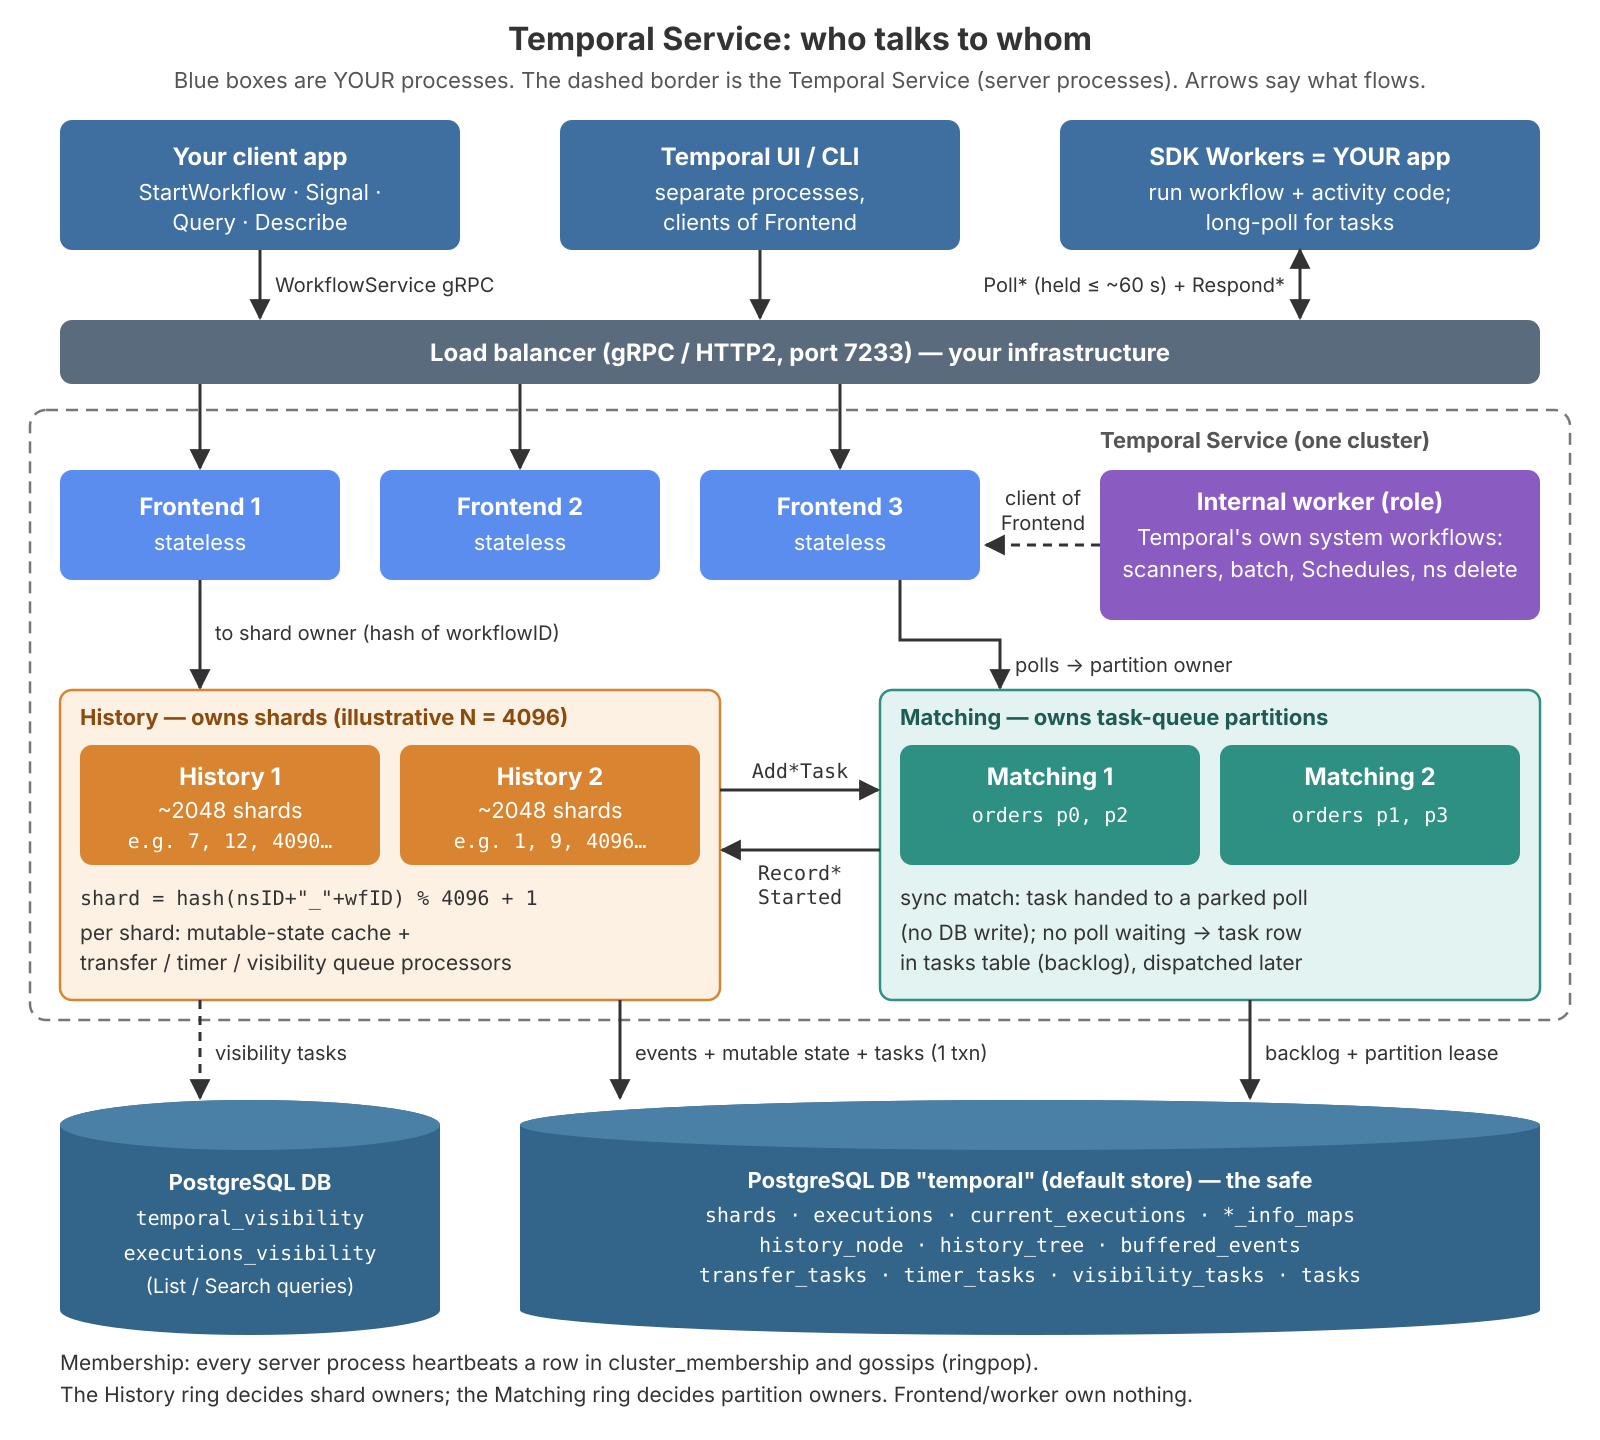
Frontend is the front door on port 7233. Clients, workers, the CLI and the UI all come in here. It handles auth, validation, namespace lookup and rate limiting, then routes the request to the History host that owns the shard for this workflow ID, or, for polls, to the Matching host that owns the task-queue partition. It's stateless.
History is the core and the only writer of workflow state. The workflow ID space is split into a fixed number of shards, and each shard has exactly one owning History host at a time. History appends events, updates mutable state, and creates the follow-up tasks that drive everything else.
Matching holds task queues like email_queue. Workers long-poll it, and it pairs tasks with waiting polls. Each queue is split into partitions, each owned by one Matching host.
Internal worker (--service=worker) runs Temporal's own system workflows: Schedules, batch operations, namespace deletion, scanners and scavengers. It's a client of Frontend, like your workers.
Around them: your client app (anything calling StartWorkflowExecution, SignalWorkflowExecution, …), the UI (temporalio/ui, a separate process and just another Frontend client), a load balancer that spreads gRPC/HTTP2 connections across Frontends only, and PostgreSQL as two logical databases: the default store (temporal: shards, executions, history, task queues) and the visibility store (temporal_visibility: executions_visibility, for List and Search).
"Worker" means two things. An SDK worker is your process, and its
temporal_*metrics come from your process. The internal worker is a Temporal server role. When an activity backlog grows, adding Temporal server hosts does nothing if the SDK workers are saturated.
Frontend is easy to operate: add copies, and a restart costs a few SDK retries and reconnecting long polls. History is the delicate one, because a workflow can have only one writer at a time. That single problem is why shards exist, and the shards post covers it in detail. When a History host restarts, everything it confirmed is already in PostgreSQL. Its shards just have no owner for a few seconds, so their workflows pause. Another host claims them by bumping the shard's range_id and loads them from PostgreSQL with a cold cache, so latency spikes for a while. Some background tasks run twice, which is harmless because each re-checks state first. Frontend restart = a few retries. History restart = a short pause plus an ownership handover. Neither loses data.
The mechanics every request shares
Two kinds of task, served by long poll
The server hands out exactly two kinds of task. A workflow task means "run the workflow code forward until it blocks again". It's short, deterministic, and produces commands. An activity task means "run this side-effecting function". It can be long and produces a result or an error. Both go through Matching on separate internal queues, even when they share a name like email_queue.
Workers get tasks by long poll: they ask once and Matching parks the request for up to matching.longPollExpirationInterval (default 1 minute; the SDK's own poll timeout is a bit longer, around 70 s in the Go SDK). The payoff is zero dispatch delay. The cost is that every parked poll holds memory on Frontend (the connection) and Matching (the waiting request), and their number depends on pollers, not load:
waiting polls ≈ worker processes × task queues × (workflow pollers + activity pollers)

200 workers × 3 task queues × 10 pollers        =  6,000 waiting polls
200 workers × 3 task queues × (10 + 10 pollers) = 12,000 waiting polls
Every pm2 instance opens its own pollers for every queue it serves. Adding instances "to go faster" multiplies parked polls even when there's no extra work, so do this arithmetic before scaling workers out. Also: never alert on service_latency for Poll* operations. They're slow by design. Alert on schedule-to-start latency and backlog instead.
Every History save: an append, then one transaction
Every change to a workflow is one History save on one shard, and it always has the same two-write shape:
- Append events to
history_node(persistence operationAppendHistoryNodes; a new run also writeshistory_tree). - One SQL transaction that checks the shard's ownership stamp, updates mutable state, and inserts follow-up tasks (
CreateWorkflowExecution/UpdateWorkflowExecution).
             ┌─ AppendHistoryNodes ───────────► history_node (+ history_tree on new run)
History  ────┤
(shard S)    └─ BEGIN
                  SELECT range_id FROM shards ... FOR SHARE   (fencing; shard-row updates take FOR UPDATE)
                  UPSERT executions             (mutable state blob, next_event_id, db_record_version)
                  UPSERT/DELETE *_info_maps     (pending activities/timers/children/signals)
                  UPSERT current_executions     (only on start/close/continue-as-new)
                  INSERT transfer_tasks / timer_tasks / visibility_tasks
                COMMIT
A host that has lost the shard fails the range_id check with ShardOwnershipLostError. That's how a zombie node is kept from corrupting a workflow. If the transaction fails after the append succeeded, the appended events are orphans that nothing points to, and the history scavenger on the internal worker deletes them later.
Two locks sit in front of this. A per-workflow lock serializes updates to one workflow. A per-shard semaphore, history.shardIOConcurrency (default 1), limits concurrent persistence writes per shard. The shards post covers both.
Follow-up tasks: a transactional outbox
The rows inserted in that transaction are history tasks, the to-do notes for follow-up work:
| Table | Examples | Executed by | Action |
|---|---|---|---|
transfer_tasks | WorkflowTask, ActivityTask, SignalExecution, StartChildExecution, CloseExecution | the shard's transfer queue processor | RPC to Matching or to another shard |
timer_tasks | UserTimer, ActivityTimeout, WorkflowTaskTimeout, ActivityRetryTimer, WorkflowBackoffTimer, DeleteHistoryEvent | the shard's timer queue processor | fire at visibility_timestamp |
visibility_tasks | StartExecution, UpsertExecution, CloseExecution | the visibility queue processor | write executions_visibility |
This is a transactional outbox, and it's why Temporal doesn't lose work. If History crashes right after the commit, the task row is still in PostgreSQL, and the next shard owner reloads and executes it. Executors are idempotent: before acting, each one re-checks mutable state ("is this activity still scheduled with this ID?") and drops stale tasks. A task can execute twice, but its effect happens once. Finished rows are range-deleted.
Sync match, backlog, and the handshake
When the transfer processor calls Matching (AddWorkflowTask / AddActivityTask), either a worker poll is already parked on that partition and gets the task directly, a sync match with no DB write, or no poll is waiting and Matching inserts the task into the tasks table (CreateTasks) as backlog. Each backlog task costs an insert, a read and a delete, plus task_queues ack-level updates. When the sync-match ratio drops, it's usually not enough worker capacity, not Matching, and Matching's PostgreSQL writes go up. Worker capacity is a database-load lever.
Before handing a task over, Matching asks History "may I start this?" (RecordWorkflowTaskStarted / RecordActivityTaskStarted). Matching's copy can be stale: already started, timed out, or the workflow closed. Without this handshake, a duplicate or expired task would reach a worker and the work would run twice. The handshake also records "started" and returns the current attempt number. If History says the task is stale, Matching drops it and keeps the poll waiting.
Tracing one workflow
Start
-
Client → Frontend:
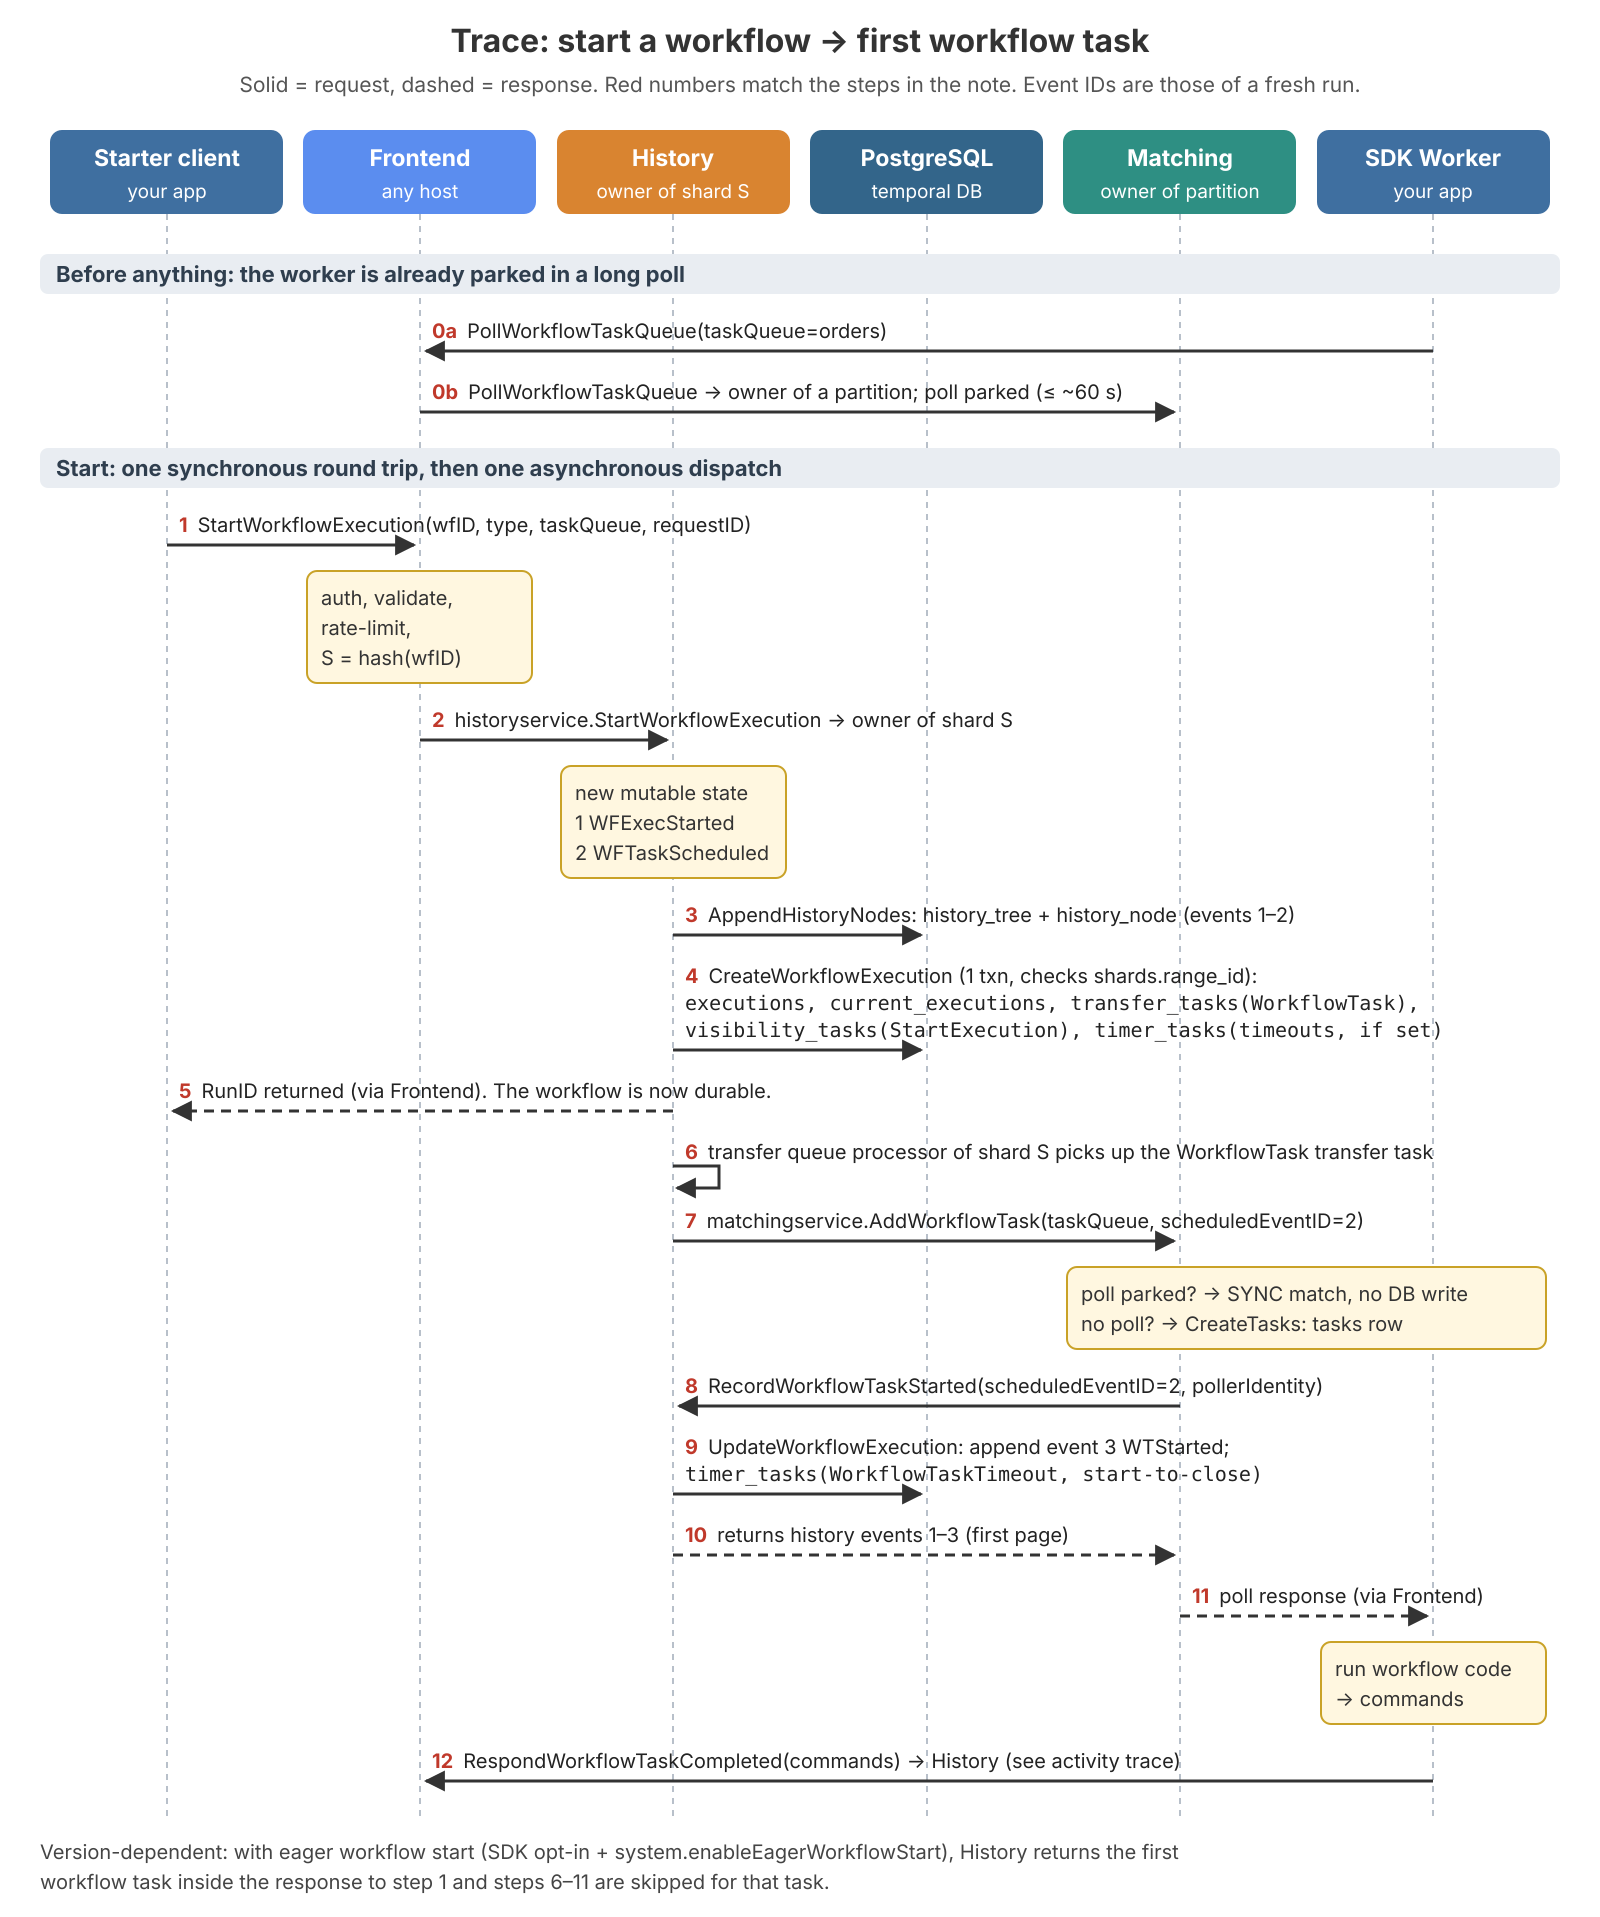
StartWorkflowExecution(workflowId, workflowType, taskQueue, input, requestId, …). Frontend authorizes, validates, applies rate limits (frontend.rps,frontend.namespaceRPS) and computes the shard, then looks up its owner in the History membership ring:shardID = farm.Fingerprint32(namespaceID + "_" + workflowID) % numHistoryShards + 1 -
Frontend → History (shard owner). History builds mutable state plus
1 WorkflowExecutionStartedand2 WorkflowTaskScheduled, and writesAppendHistoryNodes. -
CreateWorkflowExecutionin one transaction: anexecutionsrow;current_executions, which is where workflow-ID uniqueness is enforced (an open run meansWorkflowExecutionAlreadyStarted, subject to the ID reuse/conflict policy, and a retried start with the samerequestIdreturns the same run ID); aWorkflowTasktransfer task; aStartExecutionvisibility task; and timeout timers only if set. -
Run ID returned. The workflow is now durable. If every server process restarted now, nothing would be lost.
-
Asynchronously: the transfer processor (notified in memory right after the commit) calls
AddWorkflowTask, Matching sync-matches or backlogs it, the handshake appends3 WorkflowTaskStartedwith aWorkflowTaskTimeouttimer (start-to-close, default 10 s), and the worker receives events 1–3.
That's about 4 History write round trips plus a visibility write before the workflow has done anything useful.
Note what is missing from steps 1–4: History never calls Matching inside your start request. A slow Matching delays the first workflow task, not the start. If starts return in 15 ms but workers get the task 4 s later, the task waited in one of two places: History's transfer queue (task_latency_queue) or the Matching backlog (temporal_workflow_task_schedule_to_start_latency, sync-match ratio). With eager workflow start (SDK opt-in plus system.enableEagerWorkflowStart, default true on recent main and off in older releases), the first workflow task is returned in the start response and step 5 disappears.
Activity scheduled, started, completed
await sendEmail(...) doesn't call sendEmail. The worker ends its workflow task with RespondWorkflowTaskCompleted([ScheduleActivityTask]). History fills in the default activity retry policy if none was given, appends 4 WorkflowTaskCompleted and 5 ActivityTaskScheduled, and in one transaction writes an activity_info_maps row (attempt 1, timeouts, policy), an ActivityTask transfer task, and an ActivityTimeout timer. Dispatch goes through Matching on the activity queue, and at the handshake History updates activity_info_maps and writes start-to-close and heartbeat timers, but appends no event.
That's deliberate. The server source says so directly: for an activity with a retry policy (nearly all of them), "we might need to retry, so do not append started event just yet, instead update mutable state and will record started event when activity task is closed." Failed attempts don't bloat the history. (Temporal's own architecture doc simplifies this and shows the event at start. The source is authoritative.) Each heartbeat is another activity_info_maps update, with some throttling depending on version, so thousands of activities heartbeating every second means thousands of DB updates per second.
When the worker reports RespondActivityTaskCompleted, History checks the token against the current attempt. A stale one (for example the attempt already timed out) is rejected with NotFound and nothing is written. Otherwise History appends 6 ActivityTaskStarted (deferred, with the final attempt), 7 ActivityTaskCompleted, and 8 WorkflowTaskScheduled, deletes the activity_info_maps row, and writes a WorkflowTask transfer task. That task goes to the sticky queue of the worker that ran the previous workflow task. That worker still has the run cached, so it receives only events 6–9 and continues after the await.
Two details matter in production:
- Buffered events. If a workflow task is already running when an activity completes or a signal arrives, History doesn't start a second one. Two concurrent deciders could issue conflicting commands, so there's only one decision in flight per workflow. New events are buffered (capped by
history.maximumBufferedEventsBatch, default 100 on recentmain) and flushed when the running task completes. It's also whyCompleteWorkflowExecutionis rejected withUnhandledCommandwhile buffered events exist. - Sticky misses. If the sticky task isn't picked up within the sticky schedule-to-start timeout (SDK default 5 s), History reschedules on the normal queue and the next worker replays the full history. Frequent restarts turn every workflow task into a full replay, which shows up as worker CPU and
ReadHistoryBranchreads.
Time is a row
await sleep('1 hour') keeps nothing running for an hour.
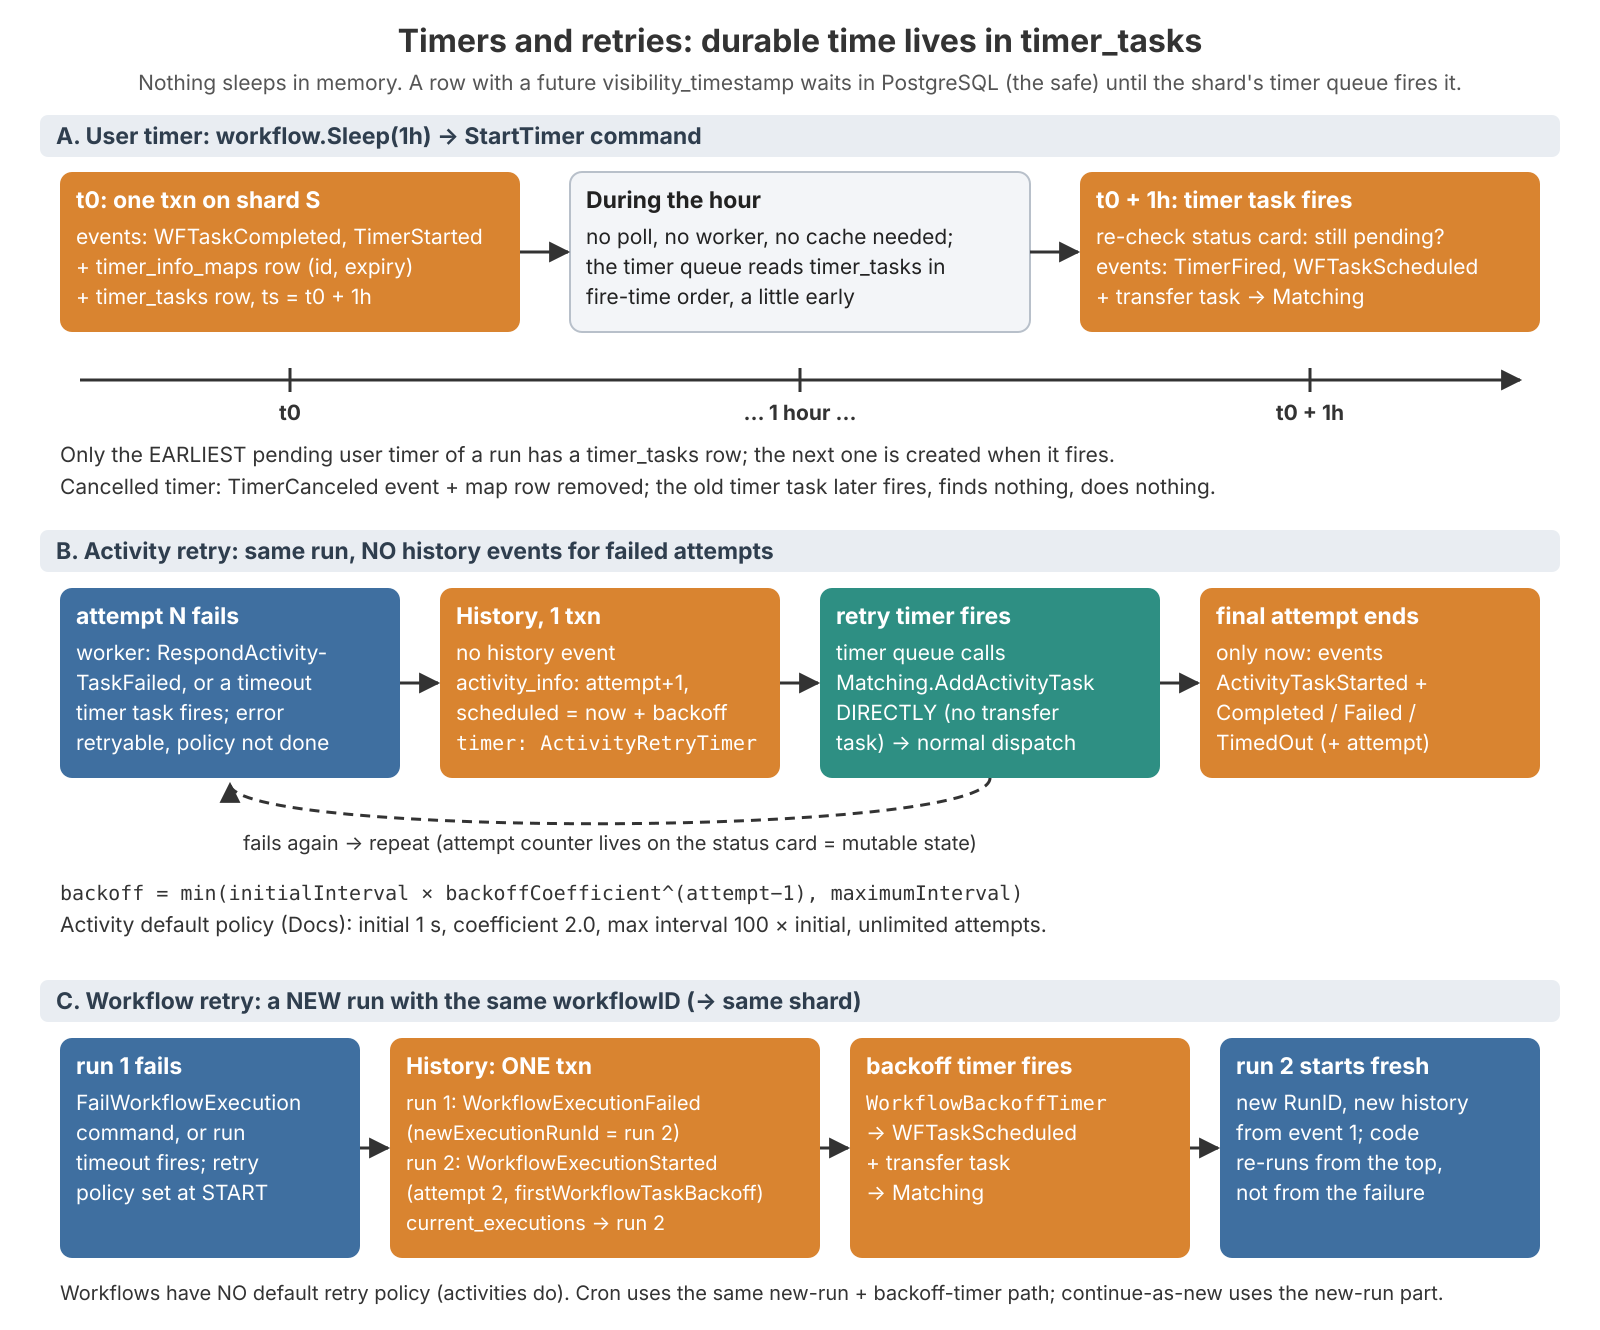
History appends TimerStarted, writes a timer_info_maps row and a timer_tasks UserTimer row with visibility_timestamp = now + 1h (only for the run's earliest pending timer), and then forgets about it. The worker can evict the run or disappear entirely. The shard's timer processor reads timer_tasks in fire-time order, a little ahead. At T + 1h it re-checks mutable state, appends TimerFired, schedules a workflow task, and writes the next timer row if there is one. A cancelled timer's row isn't deleted. It fires, finds nothing pending, and does nothing.
Every kind of server-side time works this way: ActivityTimeout, WorkflowTaskTimeout, ActivityRetryTimer, WorkflowBackoffTimer, run/execution timeouts, and DeleteHistoryEvent, which deletes a closed run's rows when retention expires. That delete is done by History, not the internal worker.
"Retry" covers two different mechanisms:
- Activity retry stays inside one run and writes no history events per failed attempt. History computes
min(initialInterval × backoffCoefficient^(attempt−1), maximumInterval), bumps the attempt inactivity_info_maps, and writes anActivityRetryTimer. When it fires, the timer processor calls Matching directly. An activity that failed 50 times before succeeding shows three activity events in its history, but the database absorbed ~50 rounds of state updates, timer rows and dispatches. With the default policy (1 s initial, ×2, max 100 s, unlimited attempts), a dead downstream means real DB load with zero progress. - Workflow retry creates a new run, and only if a retry policy was set at start. In one transaction, run 1 closes with
newExecutionRunId, run 2 is created (attempt 2, original input),current_executionsmoves to run 2, and aWorkflowBackoffTimeris written. Run 2 replays from event 1. Cron and continue-as-new use the same machinery, always on the same shard, because the shard key is namespace + workflow ID, not run ID.
Two design rules follow. First, a million workflows sleeping "until midnight" fire in the same second. They're spread across shards, but each shard's timer queue still has to chew through its share, so add jitter. Second, timers use wall-clock timestamps, so keep NTP healthy. The timeouts and retries post goes deeper on all of this.
One hot workflow ID
Signals follow the same pattern. Frontend routes to the target's shard owner, and History appends WorkflowExecutionSignaled (buffered if a workflow task is in flight), records the requestId in signals_requested_sets for dedup, and schedules a workflow task. A workflow signalling another workflow on a different shard goes through a transfer task and a direct History→History call, roughly 4–6 transactions across two shards for one line of code (my estimate from the trace; measure it).
The trap is load on one workflow ID. Every update to it serializes on its lock on one shard, so thousands of signals to one workflow get RESOURCE_EXHAUSTED with cause BusyWorkflow, and no number of History hosts helps. More hosts spread different workflows, never one. The fix is in workflow design: batch the signals, or split the entity across several workflow IDs.
Count the trips
Add it all up for the simplest real workflow, start → one activity → complete:
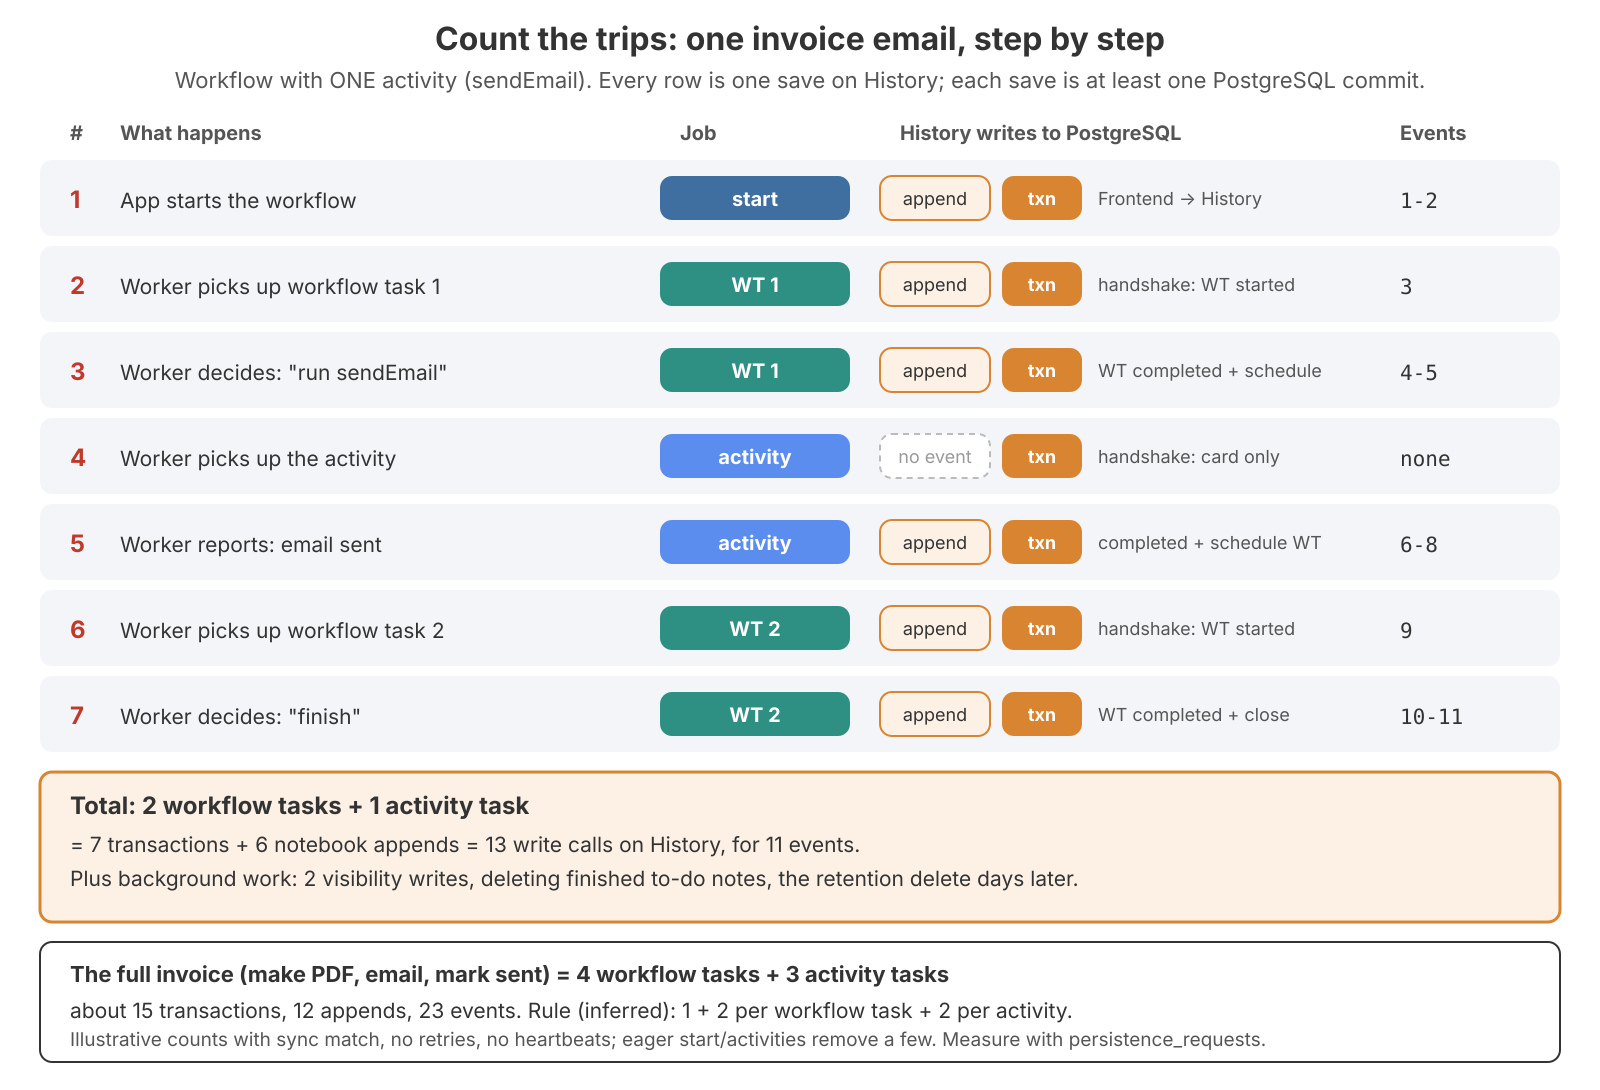
2 workflow tasks + 1 activity task = about 7 transactions and 6 history appends for 11 events, plus background work (2 visibility writes, range-deleting finished task rows, the retention delete days later). The three-step invoice is 4 workflow tasks + 3 activity tasks: about 15 transactions, 12 appends, 23 events. Adding a one-hour sleep to the one-activity version makes it about 10 transactions and 9 appends for 16 events.
These counts are illustrative and inferred from the traces: sync match everywhere, no retries, no heartbeats. Eager start and eager activities remove a few, and backlog matches add tasks writes. For estimating:
transactions ≈ 1 (start) + 2 per workflow task + 2 per successful activity attempt + 1 per timer fired
appends      ≈ transactions − 1 per activity start
Two activities and no timers: 1 + 3×2 + 2×2 = 11 transactions. Each is at least one PostgreSQL commit while holding the shard's write slot, so at 10 ms per commit that's ~110 ms of shard time for one small workflow (illustrative numbers).
That's why Temporal capacity is measured in state transitions per second (state_transition_count), not workflows per second. A "workflow" can be 10 transitions or 10,000. It's also why History plus PostgreSQL is almost always the bottleneck. To count the trips for real:
# State transitions per second: the real unit of Temporal load
sum(rate(state_transition_count_sum[5m]))   # or the counter form on your version; grep state_transition

# Persistence calls per operation
sum by (operation) (rate(persistence_requests{service_name="history"}[5m]))
Four patterns, and where to look
Everything above reduces to four patterns:
- One workflow, one shard, one writer. Every change is a transaction on the workflow's shard, fenced by
range_id. One workflow ID's throughput is bounded by serialized commits, and no number of hosts changes that. - Intent first, dispatch later. History never calls Matching or another shard inside your request. It writes a task row, and a queue processor delivers it. "Accepted" and "delivered" are different moments, so watch queue lag (
task_latency_queue). - Matching stores only what it can't hand over. Sync match = no DB write. Backlog = insert + read + delete.
- Time is a row. Timers, timeouts, retries and retention all land on
timer_tasks, and they create DB load later than the call that caused them.
The map I use when someone says "Temporal is slow":
| Symptom | Most likely hop | First metric |
|---|---|---|
Clients get RESOURCE_EXHAUSTED | Frontend rate limits, or one busy workflow | service_errors_resource_exhausted by resource_exhausted_cause |
| Start/Signal p99 high, DB fine | History CPU, shard semaphore, workflow lock | service_latency{service_name="history"}, semaphore_latency{operation="ShardInfo"}, lock_latency |
| Start/Signal p99 high, DB commits slow | PostgreSQL | persistence_latency by operation |
| Accepted but tasks reach workers late | transfer/timer queue lag | task_latency_queue |
| Schedule-to-start high, worker slots at 0 | SDK workers | temporal_worker_task_slots_available |
| Schedule-to-start high, slots free | Matching, partitions, poll limits | poll_success_sync ÷ poll_success, Matching CPU |
| Timers fire late | timer queue, timer_tasks range reads | task_latency_queue{operation=~"Timer.*"} |
# Where does a start spend its time? Request vs shard semaphore vs DB (p99)
histogram_quantile(0.99, sum by (le) (rate(service_latency_bucket{service_name="history", operation="StartWorkflowExecution"}[5m])))
histogram_quantile(0.99, sum by (le) (rate(semaphore_latency_bucket{operation="ShardInfo"}[5m])))
histogram_quantile(0.99, sum by (le) (rate(persistence_latency_bucket{operation="CreateWorkflowExecution"}[5m])))

# Sync match ratio: closer to 1 means workers keep up
sum(rate(poll_success_sync[5m])) / sum(rate(poll_success[5m]))
Metric names and operation labels vary by server and SDK version, and some SDKs add _seconds or _total suffixes. Check what each role actually exports before you build a panel:
curl -s http://<history-host>:9090/metrics \
  | grep -E '^(service_latency|persistence_latency|semaphore_latency|task_latency_queue)' \
  | cut -d'{' -f1 | sort -u

# Is anyone polling this queue right now?
temporal task-queue describe --task-queue email_queue
For the worker side of metrics, and why I export SDK metrics over OTLP when several workers share a host, see Temporal SDK metrics: Prometheus exporter vs OTLP.
What I'd tell myself before go-live
- The server remembers and hands out jobs. Workers run all the code. "Temporal is slow" is a worker problem until the metrics say otherwise.
- Nothing is confirmed before it's in PostgreSQL, so server failures cost time, not data. Plan for the pause and the recovery burst.
- Workflow code must be deterministic. Activities are at-least-once. Every side effect goes in an activity with an idempotency key.
- Every step is an append plus a transaction on one shard. A one-activity workflow is ~7 commits. Measure load in state transitions.
- Intent first, dispatch later. A fast start with a late first task points at the transfer queue or the Matching backlog.
- Worker capacity is a database lever. Missing pollers turn free sync matches into
tasksinserts, reads and deletes. - Count your pollers before scaling workers out. Processes × queues × pollers, and Frontend and Matching pay for every one.
Next in the series: Frontend and History, covering the rate limiters at the front door, and how History's event log, mutable state and task tables make sure it never loses a task, even when it crashes mid-step.