Temporal Server Cheat Sheet: The Decision Trees, Knobs, Metrics and Checklists I Keep Open On Call
On this page
- The ten lines
- Tree one: shelf, desk or server?
- Two shortcuts
- When nothing is high but the SLO still burns
- Tree two: what do we scale?
- Knobs people confuse
- The four scaling knobs
- The other pairs
- The numbers I keep redoing
- Metrics checklist
- The traps
- Failure drills, one line each
- Go-live readiness checklist
- Questions I can now answer
- Closing the series
TL;DR: When someone says "Temporal is slow", ask one question first: is the wait on the shelf (no worker picked the task up), at the desk (the activity itself is slow) or in the server (admitting, writing or dispatching it is slow)? Four numbers answer it in a fixed order: schedule-to-start, slots available, activity execution latency, server latency. When the question becomes "what do we scale?", check in a fixed order too: SDK workers, then PostgreSQL, then Frontend, History, Matching, the internal worker, and finally limits and plumbing. PostgreSQL comes before every Temporal role because scaling Temporal in front of a saturated database makes it worse. Every action has a side effect you must be able to name before you turn the knob. A latency stuck at an exact number is a timer or a limit, not load. Size everything for one node down, and remember that Temporal fails paused, not lost: the danger is the recovery burst.
This is the last post in the series, and it's the one I actually keep open during an incident. The other nine explain why Temporal behaves the way it does on PostgreSQL. This one is the compressed version: the two decision trees, the knobs that look alike and aren't, the arithmetic I keep redoing, the metrics I alert on, and the checklist I'd walk before calling a cluster production-ready.
The reason it exists is a 3 a.m. lesson. You open Grafana, there are two hundred panels, and every one of them is a little red, because when one part of Temporal is slow everything downstream waits too. A slow disk makes commits slow, which keeps the per-shard pens busy, which makes History slow, which makes dispatch slow, which raises schedule-to-start on every queue. Going down a list of metrics top to bottom doesn't work: every metric looks guilty. What works is a fixed order of questions where each answer picks the branch.
Where something here needs more than a line, I link to the post that owns it.
The ten lines
If I could only keep ten sentences from the whole series, they'd be these:
- The server remembers and hands out jobs. Workers run all the code. (post 1)
- Every step is saved to PostgreSQL before History says OK. Failures cost time, not data. (post 2)
- A shard is a box of workflows with exactly one owner. The membership ring picks the owner; the
range_idstamp in PostgreSQL enforces it. (post 3) numHistoryShardsis chosen once, forever. Adding hosts moves boxes; it never adds boxes.- Shards scale many workflows. They do nothing for one hot workflow.
- "Temporal is slow": first ask whether the wait is on the shelf, at the desk, or inside the server. (post 7)
- A latency stuck at an exact number (4.9 s, 70 s) is a timer or a limit, not load.
- The smallest ceiling wins, and 60–70% of it, with one node down, is "full".
- Anything sized per host or per shard changes when a node dies. Size for N-1. (post 6)
- Temporal fails paused, not lost. The danger is the recovery burst. (post 9)
Tree one: shelf, desk or server?
A task can only wait in three places. A task queue is a shelf at the job counter (Matching); a worker's poller is a hand that grabs a task only when one of its slots, a desk, is free; behind the counter is the server. So:
- On the shelf, because no hand came for it: schedule-to-start.
- At the desk, because the work itself is slow: activity execution latency.
- In the server, because admitting, writing or dispatching it was slow: server latency.
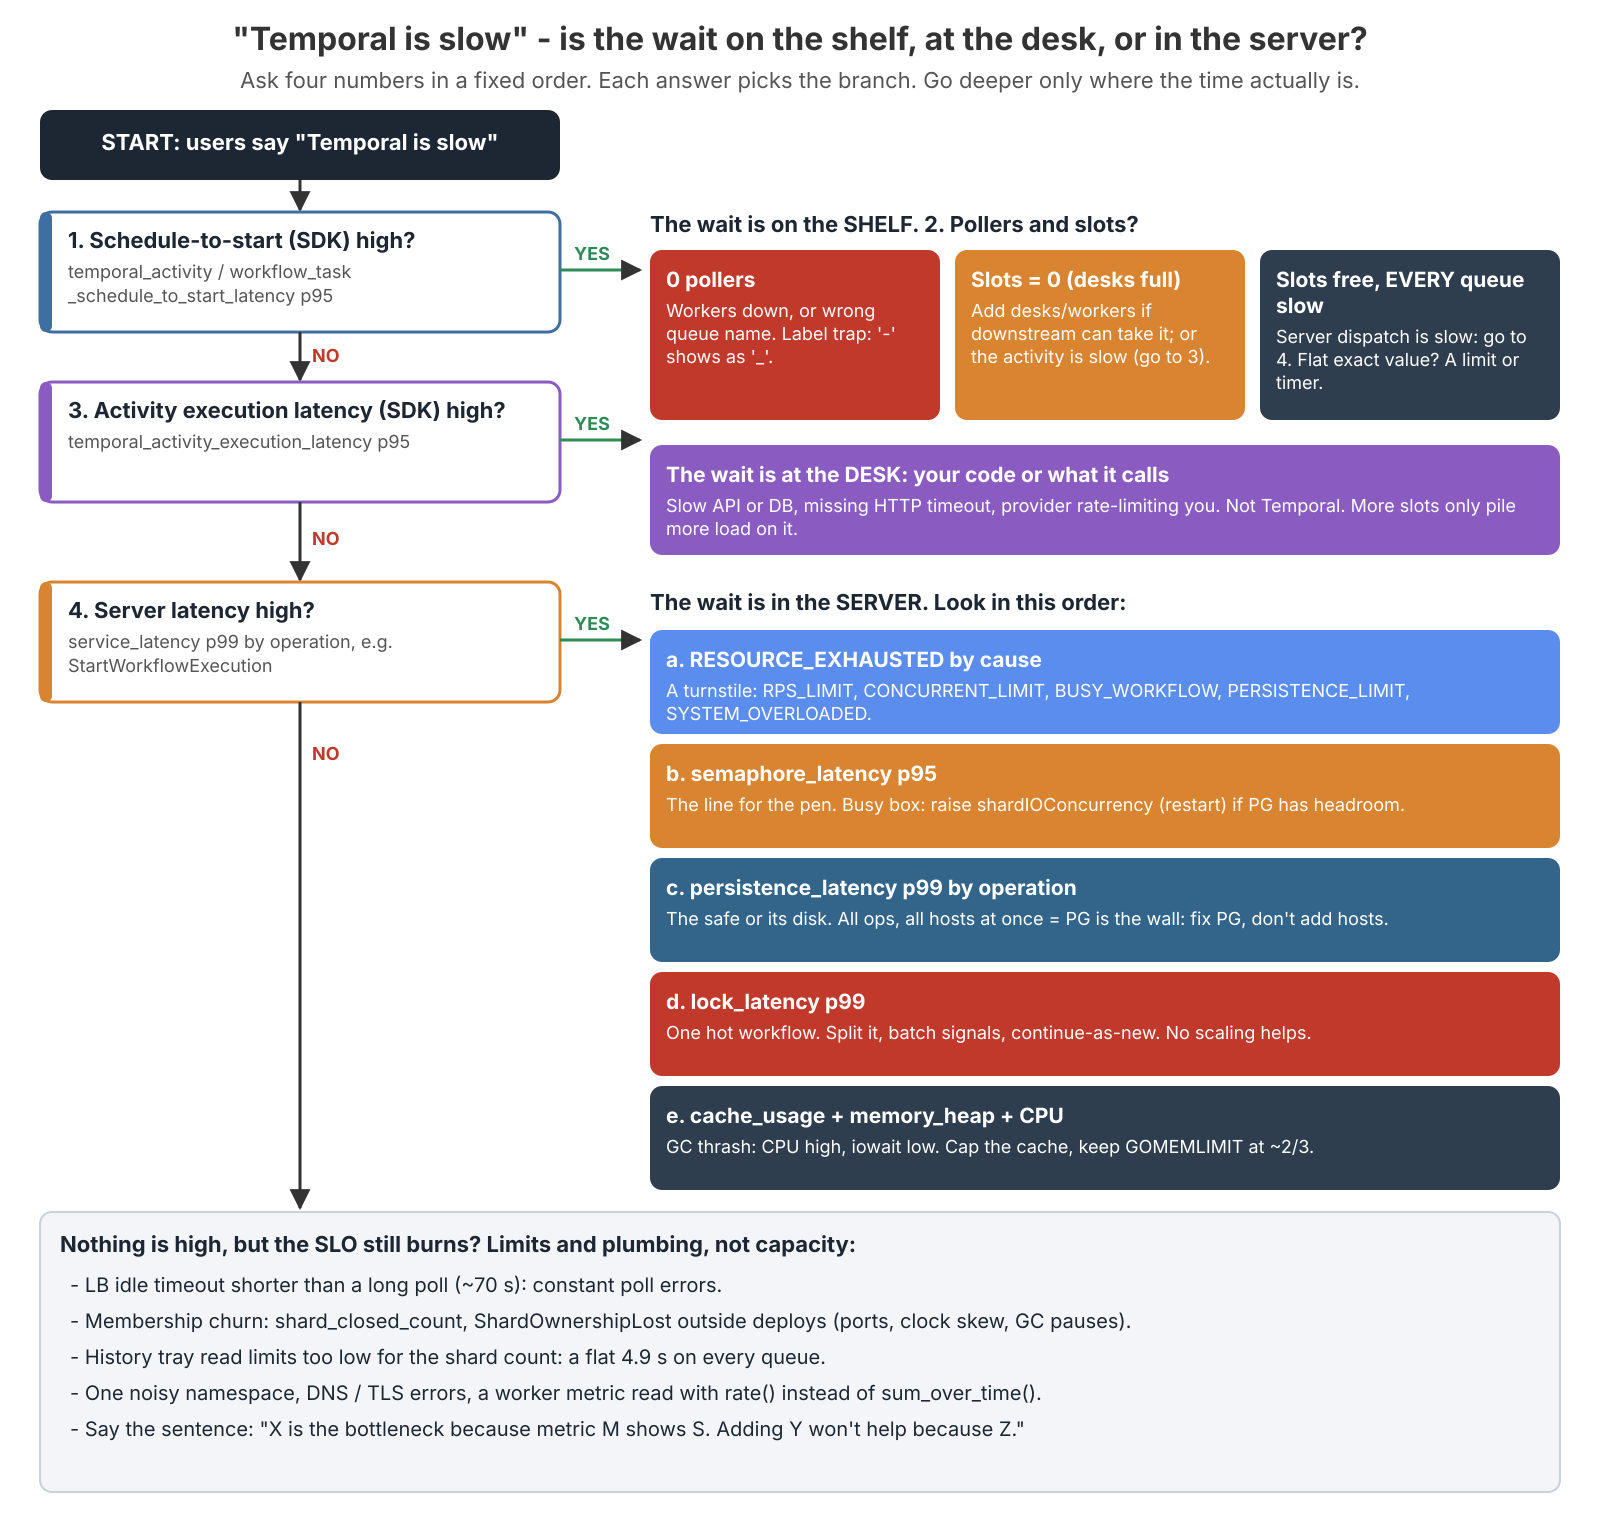
1. Schedule-to-start high? (temporal_activity_schedule_to_start_latency, temporal_workflow_task_schedule_to_start_latency). The wait is on the shelf. Pollers and slots tell you who to blame:
| What you see | What it means |
|---|---|
| High schedule-to-start, 0 pollers | Workers are down, or polling the wrong queue name (check the label trap: - shows up as _) |
High, pollers present, temporal_worker_task_slots_available at 0 | Workers are full: add desks or workers, or the activity is slow (step 3) |
| Low schedule-to-start, but the job runs slowly | The activity is slow: your code or what it calls |
| High on every queue at once, workers idle with free slots | The server is slow to hand out jobs (step 4) |
3. Activity execution latency high? (temporal_activity_execution_latency). The wait is at the desk: a slow API or database, a missing HTTP timeout, a provider rate-limiting you. Not Temporal. More slots only pile more load onto the slow downstream.
4. Server latency high? (service_latency by operation, e.g. StartWorkflowExecution). Look inside the server, in this order:
| Look at | If high, it is… | Depth |
|---|---|---|
service_errors_resource_exhausted by cause | A rate limiter saying no: RPS, concurrent polls, busy workflow, persistence limit, system overloaded | post 2 |
semaphore_latency p95 | The queue for a shard's IO slot (a busy shard) | post 3 |
persistence_latency p99 by operation | PostgreSQL or its disk | post 6 |
lock_latency p99 | One hot workflow waiting on its own lock | post 3 |
cache_usage + memory_heap + CPU | GC thrash | post 6 |
The sentence I say out loud on a call: "First I separate shelf time from desk time from server time, then go deeper only where the time actually is."
Two shortcuts
An exact number is a timer or a limit, not load. Load produces a spread; a setting produces a flat line. Find the setting equal to the number. Three I've hit:
- ~70 s heartbeat stalls: a 60 s heartbeat timeout plus ~10 s before the server noticed and scheduled the retry. pm2 had SIGKILLed the worker after 5 s. (post 5)
- A flat ~4.9 s schedule-to-start on every queue: the per-host transfer-tray read limit (
history.transferProcessorMaxPollHostRPS, 120 on that cluster; verify the name and default on your version) shared by 512 shards, so each shard's transfer tray was read only every 512 ÷ 120 ≈ 4.3 s, and every dispatch waited that long. - 5–10 s workflow-task stalls after a deploy: the sticky-queue timeout expiring after workers were SIGKILLed. (post 4)
Before listing suspects, ask which single setting would produce this number. We once saw 800 UpdateTaskQueue writes/s. The rate is roughly active partitions ÷ matching.updateAckInterval. At the 1-minute default, 800/s needs 48,000 active partitions: not plausible. At 0.5 s it needs 400, about 100 queues × 4 partitions: plausible. So the interval had been set far too low. Fixing it took the rate from 795/s to 8/s. Doing that arithmetic out loud beats any dashboard.
When nothing is high but the SLO still burns
Then it's limits and plumbing, not capacity:
- A load balancer idle timeout shorter than a long poll (~70 s): constant poll errors.
- Membership churn:
shard_closed_countandShardOwnershipLostoutside deploys (ports, clock skew, GC pauses). (post 8) - History tray read limits too low for the shard count: the flat 4.9 s.
RESOURCE_EXHAUSTEDwith cause persistence limit:persistenceMaxQPStoo low for N hosts.- One noisy namespace; DNS or TLS errors.
- A broken graph, not a broken cluster: a worker counter read with
rate()instead ofsum_over_time(), orle="1"instead ofle="1.0".
Fix config; do not buy hosts.
Tree two: what do we scale?
The first tree tells you where the time is. Once the time is in the server and something is genuinely saturated, the second tree tells you what to change.
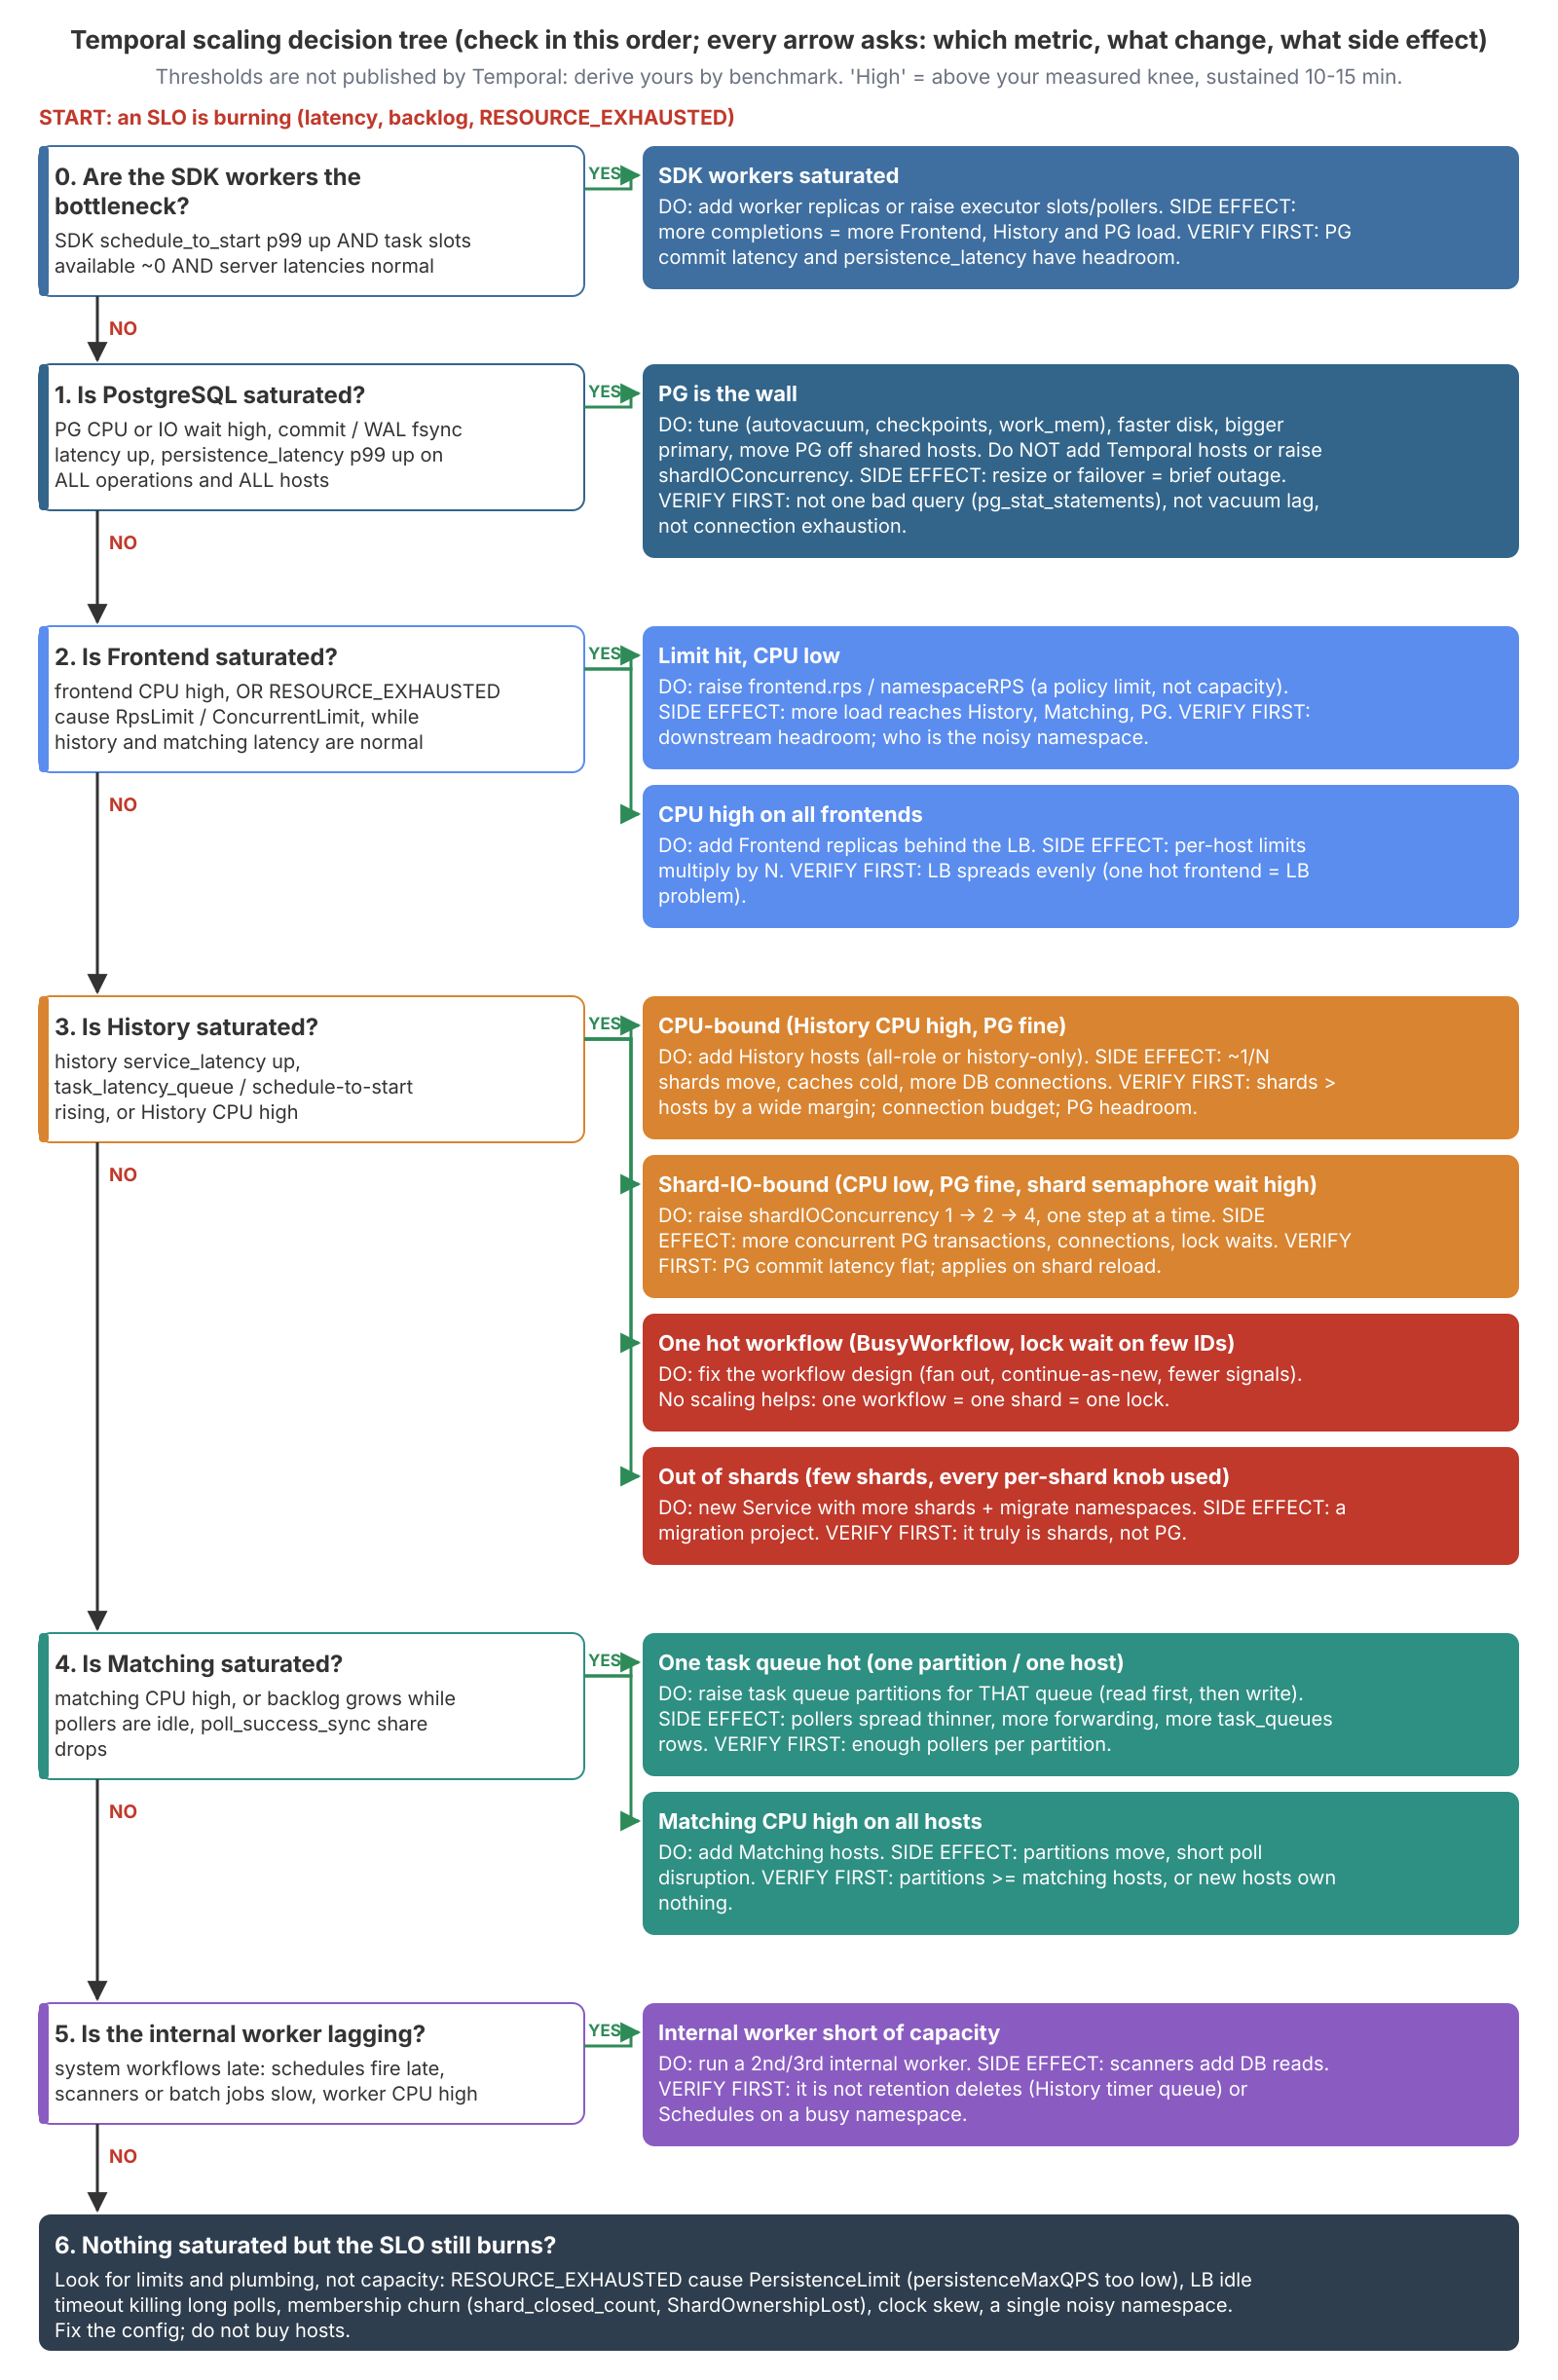
"High" here means above your own measured knee, sustained for 10–15 minutes. Temporal publishes no thresholds. The text version, condensed:
START: an SLO is burning (latency, schedule-to-start, backlog, RESOURCE_EXHAUSTED)
│
├─0─ SDK WORKERS saturated?
│     schedule_to_start p99 up AND slots_available ≈ 0 AND server latencies normal
│     DO: more worker replicas, or more slots/pollers
│     SIDE EFFECT: more completions → more Frontend RPS, History writes, PG commits;
│                  more pollers → more parked long polls (CONCURRENT_LIMIT, server memory)
│     VERIFY: PG has headroom; worker CPU isn't the real limit; the downstream API can take it
│
├─1─ POSTGRESQL saturated?
│     PG CPU/IO wait high, commit/WAL fsync latency up, persistence_latency up on ALL ops, ALL hosts
│     DO: tune (autovacuum on queue tables, checkpoints), faster disk, bigger primary,
│         dedicated host, split visibility, cut writes per workflow
│     DON'T: add Temporal hosts, raise shardIOConcurrency, add partitions (all push MORE at PG)
│     VERIFY: not one bad query (pg_stat_statements), not vacuum lag, not connections, not UI searches
│
├─2─ FRONTEND saturated?
│     ├─ limit hit, CPU low → raise frontend.rps / namespaceRPS (policy, not capacity)
│     │                       VERIFY: downstream headroom; maybe that namespace SHOULD be limited
│     └─ CPU high on all    → add Frontend replicas; per-host limits now multiply by N
│
├─3─ HISTORY saturated?
│     ├─ CPU-bound (PG fine)          → add History hosts; ~1/N shards move, caches go cold
│     │                                 VERIFY: shards ≫ hosts, connection budget, not GC thrash
│     ├─ shard-IO-bound (CPU low, PG fine, semaphore wait high)
│     │                               → shardIOConcurrency 1 → 2 → 4, one step at a time
│     ├─ ONE HOT WORKFLOW (BusyWorkflow, lock latency on few IDs)
│     │                               → redesign: split by key, batch signals, continue-as-new
│     │                                 NO scaling helps: one workflow = one shard = one lock
│     └─ OUT OF SHARDS                → new Service with more shards + migrate namespaces
│
├─4─ MATCHING saturated?
│     ├─ one task queue hot  → raise read, then write partitions for THAT queue
│     └─ CPU high on all     → add Matching hosts (partitions ≥ hosts, or new hosts own nothing)
│
├─5─ INTERNAL WORKER lagging? (schedules fire late, scanners slow) → run a 2nd/3rd copy
│
└─6─ NOTHING saturated → limits and plumbing. Fix config; do not buy hosts.
SDK workers go first because they're the most common cause and the cheapest fix. PostgreSQL goes second because every Temporal-side scaling action sends more concurrent work at the one primary; if the database is the wall, everything else makes it worse. And of History's four "saturated" leaves, only the CPU-bound one is fixed by adding hosts.
Every pass through the tree should end in one sentence of this shape:
"X is the bottleneck because metric M shows S. Adding more Y won't help because Z. I'll change A, which increases pressure on B, so I first verify C."
If I can't fill in every slot, I gather more data before touching anything.
One version note: the resource_exhausted_cause values appear as RpsLimit / ConcurrentLimit / BusyWorkflow / PersistenceLimit in some versions' metric labels and as RPS_LIMIT / CONCURRENT_LIMIT / … in the API enum. Check what your /metrics actually emits before writing a query.
Knobs people confuse
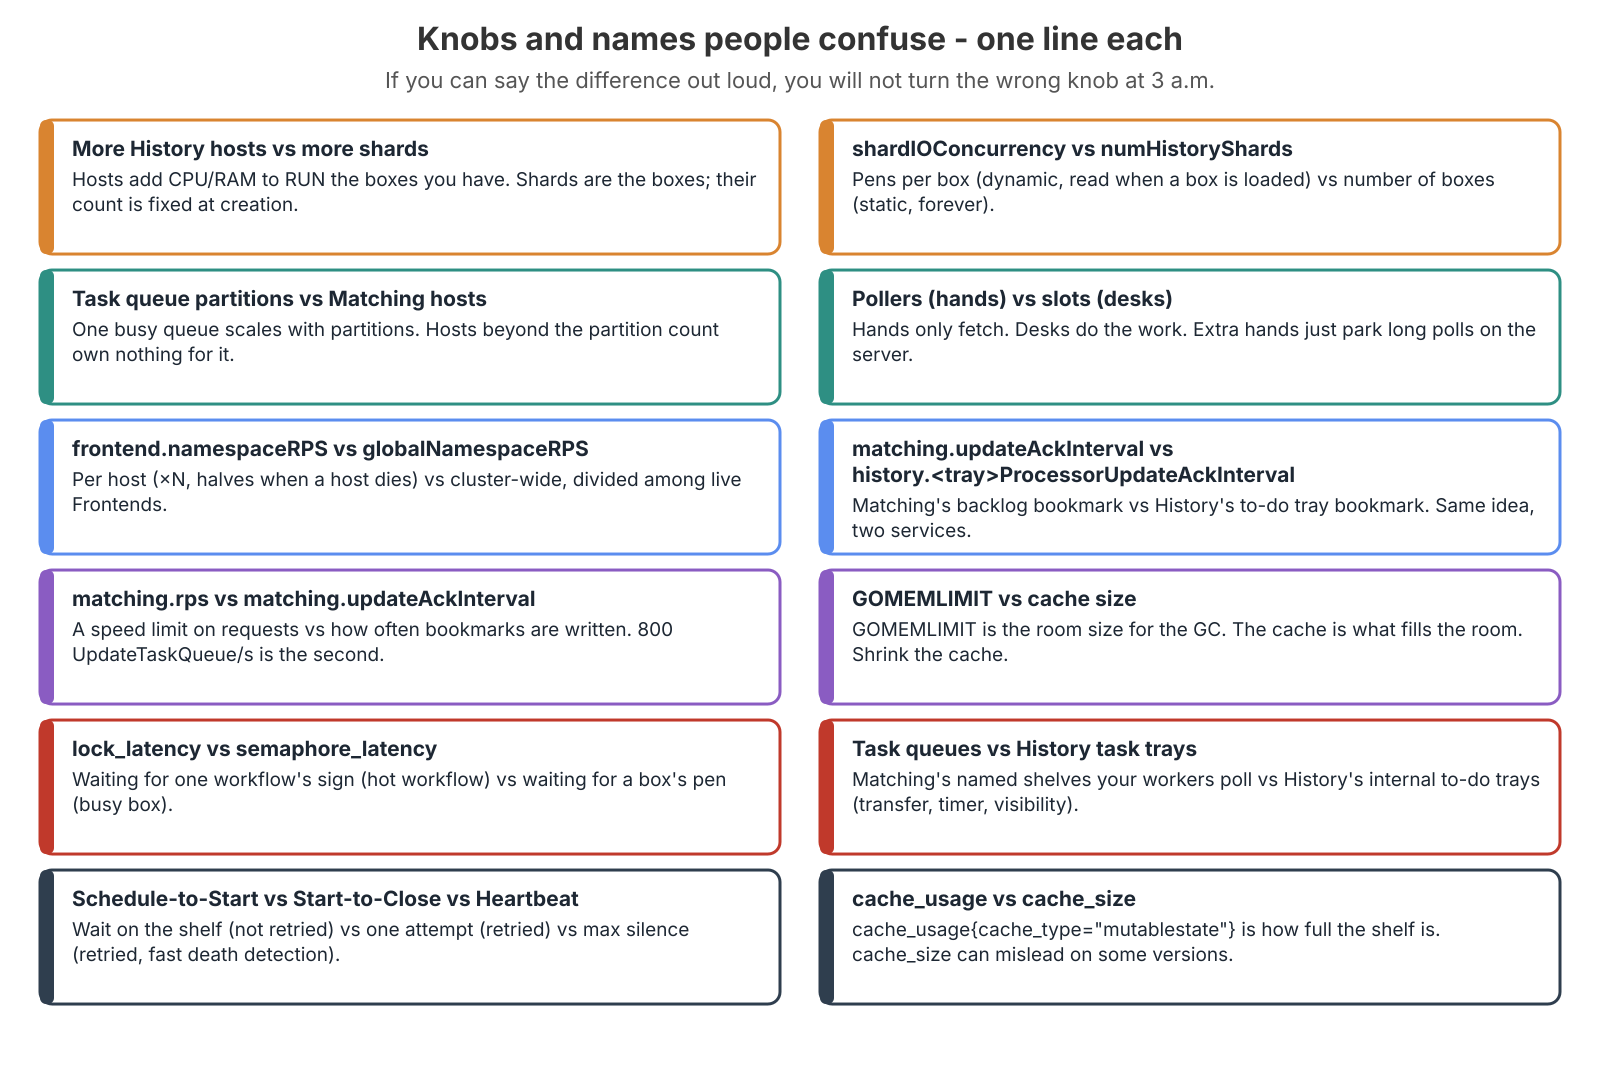
The four scaling knobs
| Knob | What it adds | Scope | Takes effect | Main side effect |
|---|---|---|---|---|
| More History hosts | CPU and memory to run existing shards | Cluster membership | On join (shards move) | Shard movement, more DB connections |
history.shardIOConcurrency | Concurrent DB writes per shard | Per shard, dynamic config | On shard reload/restart | More concurrent PG transactions |
numHistoryShards | Total units of ownership and parallelism | Whole Service, immutable | Never (new Service) | Memory and background DB polling per shard |
| Task queue partitions | Parallelism for one task queue | Per queue, dynamic config | Live | Pollers spread thinner, more forwarding |
Which of these are fixed forever, read at init (restart needed) or live is its own table in post 8; the short version is that numHistoryShards, the cluster name and the persistence backend are decided once, shardIOConcurrency and cache sizes need a reload or restart, and rate limits, partitions and updateAckInterval change live.
The other pairs
| Pair | The difference |
|---|---|
| Pollers vs slots | Pollers only fetch, in milliseconds; slots do the work. A poller reaches out only if a slot is free. Extra pollers just park more long polls on Frontend and Matching. |
maxConcurrentActivityTaskExecutions vs maxConcurrentActivityTaskPolls | Activity slots vs activity pollers (TypeScript SDK names); same split for workflow tasks. |
frontend.namespaceRPS vs frontend.globalNamespaceRPS | Per host (multiplies by N, halves when one of two hosts dies) vs cluster-wide per namespace, enforced as limit ÷ live Frontends. |
frontend.namespaceCount vs frontend.namespaceRPS | Parked long polls per namespace per host (CONCURRENT_LIMIT) vs requests per second (RPS_LIMIT). |
matching.updateAckInterval vs history.<tray>ProcessorUpdateAckInterval | Matching's backlog bookmark (in task_queues) vs History's task-tray bookmark (in shards). Same idea, two services. |
| Task queues vs History task trays | Matching's named queues your workers poll vs History's internal transfer_tasks, timer_tasks, visibility_tasks. Both get called "queues". |
lock_latency vs semaphore_latency | Waiting on one workflow's lock (hot workflow) vs waiting for a shard's IO slot (busy shard). Different fixes. |
| GOMEMLIMIT vs cache size | GOMEMLIMIT is the room the garbage collector works in; the cache is what fills it. Shrink the cache; keep GOMEMLIMIT ≈ 2/3 of the container limit. |
cache_usage vs cache_size | cache_usage{cache_type="mutablestate"} is how full the mutable-state cache is. cache_size reports a misleading number on some versions. |
| Schedule-to-Start vs Start-to-Close vs Schedule-to-Close vs Heartbeat | Wait in the queue (not retried) vs one attempt (retried) vs everything including retries (final) vs max silence between heartbeats (retried, fast death detection). |
patched() vs Worker Versioning | A version branch inside the code vs routing old runs to old workers by build ID. |
| Replay vs retry | Replay re-runs workflow code against the history; no activity re-runs. Retry re-runs an activity attempt. |
| Internal worker vs SDK worker | Temporal's own system workflows (schedules, batch, scanners) vs your process running your code. Retention deletes are neither: they're History timer tasks. |
The numbers I keep redoing
Most of these are from our own clusters; the rules of thumb are labelled. They're there to show the shape of the arithmetic, not as limits to copy.
| What | Formula / number |
|---|---|
| Which shard | farm.Fingerprint32(namespaceID + "_" + workflowID) % numHistoryShards + 1 (namespace ID, not name; shard IDs start at 1; run ID not included) |
| Shard IO ceiling | max writes/s ≈ shards × shardIOConcurrency ÷ time each write holds the slot |
| Too few shards vs enough | 4 shards × 1 slot at ~10 ms ≈ 400 writes/s (slots ~97% busy, starts went from 46 ms to 1.4 s) vs 512 × 4 at ~13 ms ≈ 157,000/s |
| Parked long polls | workers × task queues × pollers per worker = 200 × 3 × 10 = 6,000 |
| Bookmark writes | UpdateTaskQueue/s ≈ active partitions ÷ updateAckInterval (795/s at 0.5 s → 8/s fixed) |
| Tray read interval | shards ÷ transferProcessorMaxPollHostRPS = 512 ÷ 120 ≈ 4.3 s → flat ~4.9 s schedule-to-start |
| Queueing (rule of thumb, M/M/1) | wait ≈ service time × busy ÷ (1 − busy): 50% → 1×, 80% → 4×, 90% → 9×, 97% → 32× |
| Planning band (rule of thumb) | Peak at 60–70% of the smallest ceiling, with one node removed |
| N-1 target | (N − 1) ÷ N × knee, minus a margin |
| Writes per workflow | Rate of persistence_requests for the create/update-execution and AddTasks operations ÷ rate of workflows started: measure yours, per workflow type |
| History CPU | ~185 ops/s per core on our hosts |
| Disk ceiling | A P30 disk ≈ 685 ops/s; 50 wf/s × 12 writes = 600/s = 88% busy: too hot |
| Disk runway | 15% left ÷ 4% a day ≈ 3.75 days → really 1–2 days to act |
| Looping workflow | ~11 events per 5-min loop × 288 ≈ 3,200/day → ~50,000-event limit in ~15 days |
| Default retries | 1, 2, 4 … capped at 100 s, forever → ~860 attempts a day |
| Recovery burst | 12,000 timers × ~4 writes ≈ 48,000 writes ÷ 685/s ≈ 70 s of disk at 100% |
| History ratio | ~1 History process per 500 shards, Temporal's documented starting ratio |
| Partition rate (rule of thumb, Temporal staff) | ~100 tasks/s per partition |
The derivations for the capacity rows live in post 7; the shard rows in post 3.
Metrics checklist
Metric names and labels change between releases, so before writing any alert I grep the real /metrics output on that version. Thresholds below are starting points I'd use on day one and replace with benchmark-derived values as soon as I have them. Server metrics are unprefixed; SDK metrics start with temporal_ (more on the SDK side in this earlier post).
| Metric | Means | Starting threshold | When crossed |
|---|---|---|---|
service_requests, service_errors by operation | Request rate and error ratio per API | Error ratio over 1% for 10 m | Split client errors (NotFound) from server errors |
service_latency p99 by operation | Where the time goes, per role | Over 2× benchmark baseline for 10 m | The first role to slow down is upstream of the problem |
service_errors_resource_exhausted by cause | A rate limiter rejecting work | Sustained over 1/s for 10 m | The cause picks the branch. SDKs retry it quietly: users see slowness, not errors |
persistence_latency p99 by operation | DB round trip as Temporal sees it | Over 100 ms on writes for 10 m | PG commit latency, CPU, IO; then network and pool waits |
persistence_errors | Connection refused, timeouts, failover | Any sustained | Page. PG health, failover state, max_connections |
task_latency_queue p95 | History tasks running late (timers, transfers) | Over 5 s for 15 m | History CPU vs shard IO vs PG. Flat exact value: tray read limits |
semaphore_latency{operation="ShardInfo"}, lock_latency | Waiting for a shard IO slot, or a workflow lock | Rising while CPU and PG are fine | Step shardIOConcurrency; or a hot workflow if concentrated on few IDs |
sharditem_created_count, shard_closed_count | Membership churn | Above 0 outside deploys | Ports, clocks, GC pauses, a flapping host |
cache_usage{cache_type="mutablestate"} | Mutable-state cache fullness | Climbing to the cap with heap near GOMEMLIMIT | Cap the cache (GC thrash) or grow it (DB reads) |
poll_success, poll_success_sync, poll_timeouts | Did tasks meet a waiting poller? | Sync share under 80% on a normally synced queue | Workers short, or partition starvation |
| Backlog count / age | Tasks waiting in the DB | Age over your schedule-to-start SLO | Workers if slots are exhausted; partitions if one queue is hot |
temporal_*_schedule_to_start_latency | Time a task waited for your worker | p99 over 1 s on latency-sensitive queues | Triage step 1 / scaling branch 0 |
temporal_worker_task_slots_available | Free slots | 0 for 10 m | Raise slots if CPU and downstream allow, else add workers |
temporal_request_failure, temporal_long_request_failure | SDK ↔ Frontend failures | Sustained non-zero | LB idle timeout, TLS, Frontend health |
| PG: commit latency, IO wait, WAL, connections, dead tuples on queue tables, replication lag, disk % | The database | Connections over 80% of max; lag over 10 s; disk over 70% | Scaling branch 1; autovacuum on queue tables; expand disk early |
The traps
| Trap | What goes wrong | Instead |
|---|---|---|
| SDK worker metrics are delta, not cumulative | rate() and increase() read every drop as a counter reset and return nonsense | sum_over_time() on worker counters; rate() is fine on server metrics |
le labels are floats | le="1" matches nothing and you get an empty graph with no error | le="1.0" |
| Task queue labels are sanitised | - becomes _; describing the label's spelling shows a false 0 pollers | Use the real queue name with - |
| Averages | They hide the fsync stalls in the tail | p95/p99 from histograms |
The queries for the four triage numbers and the five server checks:
# 1. Schedule-to-start (SDK; if your workers export delta histograms, use sum_over_time)
histogram_quantile(0.95, sum by (le, task_queue) (rate(temporal_activity_schedule_to_start_latency_bucket[5m])))

# 2. Free slots per queue and worker type
min by (task_queue, worker_type) (temporal_worker_task_slots_available)

# 3. Time at the desk
histogram_quantile(0.95, sum by (le, activity_type) (rate(temporal_activity_execution_latency_bucket[5m])))

# 4. Server latency per operation
histogram_quantile(0.99, sum by (le, operation) (rate(service_latency_bucket{service_name="frontend"}[5m])))

# 4a. Which rate limiter
sum by (resource_exhausted_cause) (rate(service_errors_resource_exhausted[5m]))
# 4b. Shard IO slot queue
histogram_quantile(0.95, sum by (le) (rate(semaphore_latency_bucket{service_name="history"}[5m])))
# 4c. The database
histogram_quantile(0.99, sum by (le, operation) (rate(persistence_latency_bucket{service_name="history"}[5m])))
# 4d. One hot workflow
histogram_quantile(0.99, sum by (le) (rate(lock_latency_bucket{service_name="history"}[5m])))
# 4e. GC thrash: cache fullness and heap
sum by (instance) (cache_usage{cache_type="mutablestate"})
sum by (instance) (memory_heap)# Check the names on your version first
curl -s http://<history-host>:<metrics-port>/metrics | grep -iE 'schedule_to_start|slots_available|semaphore|lock_latency|cache_usage'
# Pollers on a queue (the real name, with '-')
temporal task-queue describe --task-queue <queue-name> --namespace <ns>-- What the database is waiting on
SELECT wait_event_type, wait_event, state, count(*)
FROM pg_stat_activity
WHERE datname = 'temporal'
GROUP BY 1, 2, 3
ORDER BY 4 DESC;Failure drills, one line each
Anything committed to PostgreSQL is safe; anything not committed is retried by whoever sent it. The walkthroughs are in post 9.
| Failure | Lost? | Main danger | First move |
|---|---|---|---|
| History node dies | No | Survivor not sized for N-1 | Confirm shard counts add up. Don't panic-restart the survivor: it moves every shard again |
| DB down or failover | No (committed data) | The recovery burst | Fix the DB. Don't scale workers up during recovery; tray read limits act as a brake |
| Disk full | No, but stuck | You can't delete your way out | Prevent it: alert at 70% and 80%. Expand first, clean up after |
| Bad deploy (non-determinism) | No | Panicked mass-termination | Roll back the worker code; stuck workflows resume on their own |
| Workers down | No | The backlog burst hits downstream | Bring workers back gradually; cap activity concurrency |
| Whole cluster down | Starts fail | The app must handle that | The code that starts workflows retries or buffers |
Go-live readiness checklist
The checklist I'd walk before calling a self-hosted cluster production. The reasoning behind the topology items is in post 9, the shard count in post 3.
Topology
- At least 3 Temporal hosts (N+1 headroom), all-role unless metrics justify a split
- Internal worker on 2 or more hosts
- SDK workers on separate machines or pods from the Temporal hosts
-
numHistoryShardschosen deliberately for a 3–5 year horizon - Cluster name, shard count and persistence config in Git, identical on every member
Network and membership
-
broadcastAddressis each host's private IP, never 127.0.0.1 - All gRPC and membership ports open between every pair of hosts, both directions
- NTP/chrony synced on every host and the database
- Ring verified: every role lists every expected member;
cluster_membershiprows are fresh
Frontend and load balancer
- One DNS name in front of all Frontends
- gRPC health check on
temporal.api.workflowservice.v1.WorkflowService - LB idle/read timeouts of at least 2 minutes (longer than a long poll)
- Drain-on-shutdown configured; rolling deploy tested
- TLS (mTLS for workers if required) and an authorizer
- Per-host limits sized so N-1 hosts carry peak, or global limits used
PostgreSQL
- Dedicated primary plus standby (Patroni with a 3-node DCS, or managed HA)
- Sync vs async replication chosen deliberately; RPO written down
-
max_connectionsat least the measured pool total plus headroom;pg_hbaper host - Autovacuum tuned for the queue tables; bloat monitored
- Backups and PITR proven by an actual restore
- PgBouncer only if verified for your exact Temporal version (I wrote up PgBouncer separately)
- Visibility database placement decided
- Disk alerts at 70% and 80%; growth per day tracked; free space kept for
pg_repack
History memory
- Mutable-state cache sized to the host (count or bytes); GOMEMLIMIT ≈ 2/3 of the container limit
- Per-host, not per-shard, cache limits, checked for the N-1 case:
history.enableHostLevelEventsCache: true        # one events cache per node, not per shard
history.eventsHostLevelCacheMaxSizeBytes: 128MiB
history.cacheSizeBasedLimit: true               # limit the mutable-state cache in bytes
history.hostLevelCacheMaxSizeBytes: 256MiB
Observability
- Prometheus scrapes every server process, every SDK worker, PG, hosts and the LB
- Dashboards from
temporalio/dashboards, fixed for your metric names - Worker delta counters queried with
sum_over_time();lelabels written as floats - Alerts for Frontend availability/latency, persistence errors and latency,
RESOURCE_EXHAUSTED, task queue lag, shard churn, process down, SDK schedule-to-start, PG connections and replication lag - Starting thresholds replaced with benchmark-derived values
- A runbook link on every alert
Capacity and resilience
- Benchmark (omes or benchmark-workers) run on the production topology; knee recorded
- Production peak at or below knee × (N−1)/N
- Writes per workflow measured per workflow type
- Drills passed: kill each role, PG switchover and failover, network partition, slow host, rolling deploy
- A post-failover check for wedged shards in the runbook
Application side (details in post 5)
- Every activity has Start-to-Close (or Schedule-to-Close); long ones heartbeat
- Permanent errors are non-retryable; a
maximumAttemptsor Schedule-to-Close safety net exists - Side-effecting activities send idempotency keys
- Replay tests against real production histories in CI; workflow changes use
patched()or Worker Versioning - Long-lived or busy workflows use continue-as-new (or Schedules); hot workflows split by key
- Payloads small; blobs in object storage, keys in the history
- Graceful worker shutdown:
shutdownGraceTimebelow pm2'skill_timeout; signals reach child processes - Pollers sized to keep slots fed, not "as many as possible"
Operations
- Upgrade path documented (schema first, one minor version at a time)
- Retention and archival set per namespace
- Per-namespace rate limits for noisy tenants
- Dynamic config changes reviewed in Git, one knob at a time
- SLOs (availability, latency, schedule-to-start) with error budgets
Questions I can now answer
When I started, I couldn't have answered most of these. Each answer is a chain, because that's how you explain it on an incident call: because X, then Y, then Z; users see this; confirm with that; fix.
A worker crashes after the email activity finished but before the next step ran. Does the customer get a second email? No. The new worker replays the workflow from the top; at sendEmail the history already has ActivityTaskCompleted, so it uses the stored result instead of calling the activity. The exception is a crash while the activity is still running: then it's retried, which is why side-effecting activities need idempotency keys.
A colleague wants to change numHistoryShards from 512 to 2048 in config and restart, "because we're slow". What's wrong? Two things. The count is stored at cluster creation; config can't change it, and if it ever re-hashed, every workflow would land in the wrong shard. And nobody has shown shards are the bottleneck; at 512 × 4 IO slots they almost certainly aren't. Walk the triage tree first.
One workflow takes 300 signals/s, lock_latency is high, semaphore_latency is fine. Will more shards help? No. One workflow ID hashes to one shard whatever the count, and all signals queue at its one lock. Split by key, batch signals, and continue-as-new; 300/s is about a million events an hour, far beyond the ~50k-event history limit.
A teammate adds an activity call between two existing ones and deploys. What happens to running workflows? Those already past that point replay into a mismatch, a non-determinism error: the workflow task fails and retries, and the workflow is stuck in Running, not failed and not lost. Roll back, redo the change behind patched(), and add a replay test against real histories. Never mass-terminate: that re-runs steps that already happened.
A History node is fine for a day after each restart, then hits 100% CPU at 0% iowait. A teammate wants a higher GOMEMLIMIT. Something fills memory slowly: the mutable-state cache. Confirm with cache_usage climbing and runtime.gcDrain on top of a CPU profile (it was 94% for us). Cap the cache (we went to 16,000 entries, 3.6 cores → 0.3); a bigger GOMEMLIMIT only gives the cache a bigger room to fill, and near the container limit it causes an iowait storm instead.
History CPU is 90%, PG CPU 30%, persistence latency flat. And the reverse: PG CPU 95%, History 30%? The first is genuinely CPU-bound History: rule out GC thrash, then add History hosts after checking PG headroom and connections. The second is the opposite case: History is idle because it's waiting on commits, and more History hosts would push more concurrent transactions at the saturated primary. Fix PostgreSQL.
Closing the series
Ten posts ago the goal was to look at a running cluster and say: "this part is the bottleneck because X; adding more Y won't help because Z; I should change A, but that puts pressure on B, so I check C first." That sentence is the whole series. The rest is knowing enough about the machine to fill in the blanks:
- The server only remembers and hands out jobs, and everything it remembers ends at one PostgreSQL primary. That primary is the ceiling, so it's checked before any Temporal role.
- Separate shelf, desk and server time first. Most "Temporal is slow" pages end at the workers or at the code the workers call.
- Exact numbers are settings. Find the one equal to the number before suspecting load.
- Name the side effect before turning the knob. Hosts move shards, pollers park connections, more concurrency means more commits at the same disk.
- Shards are forever and don't help one hot workflow. Choose the count once; fix hot workflows in the workflow.
- Size for N-1, including the per-host limits and per-shard caches that silently double on a survivor.
- Temporal fails paused, not lost. Roll back, don't terminate, and plan for the recovery burst.
If you're starting at the beginning, the series opens with why Temporal exists and its four services.
Find me on GitHub. Corrections and Temporal war stories welcome.